
Overview#
You can configure Grafana integration to record and monitor file transfer tasks and device status changes as Grafana annotations.
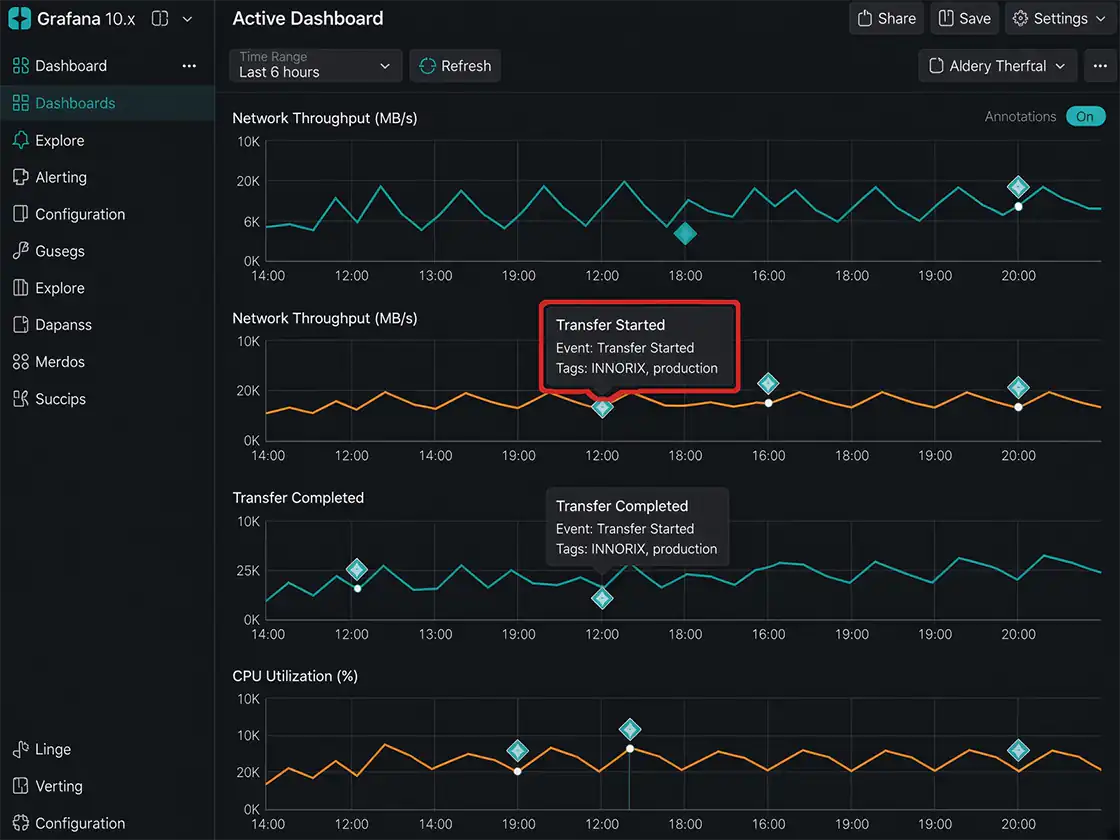
After completing the integration, an annotation is created in Grafana whenever designated events occur, such as a transfer being Started (Transfer Started) or Completed (Transfer Completed), or a device being Connected (Device Connected) or Disconnected (Device Disconnected). You can filter and view annotations on the dashboard using the specified Default Tags.
The entire process consists of two steps: ① Issue a Service Account Token → ② Configure the integration in the product.
Prerequisites#
Before you begin, check the following.
| Item | Description |
|---|---|
| Grafana account | A Grafana account with organization administrator permissions to create service accounts and tokens is required. |
| Grafana Base URL | Check the Grafana instance URL where annotations will be recorded. |
| Network | Network access to the Grafana Base URL must be available from the environment where the product is installed. (Port 443 when using a reverse proxy, or the default port 3000 for direct access) |
Issue a Grafana Service Account Token#
To record annotations in Grafana, create a Service Account and issue a Service Account Token.
Step 1. Create a Service Account#
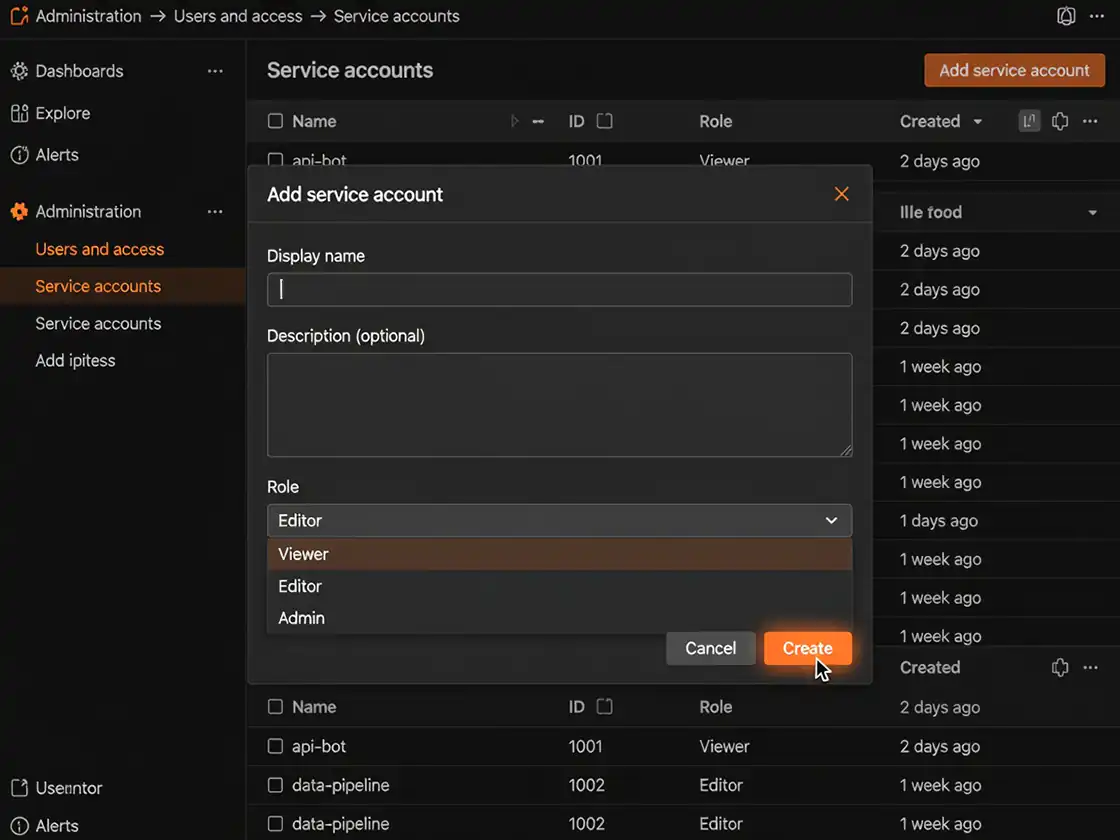
In Grafana, go to Administration → Users and access → Service accounts → Add service account.
Enter a service account name and assign a Role.
ℹ️ Creating annotations requires Editor permission or higher.
Step 2. Create a Service Account Token#
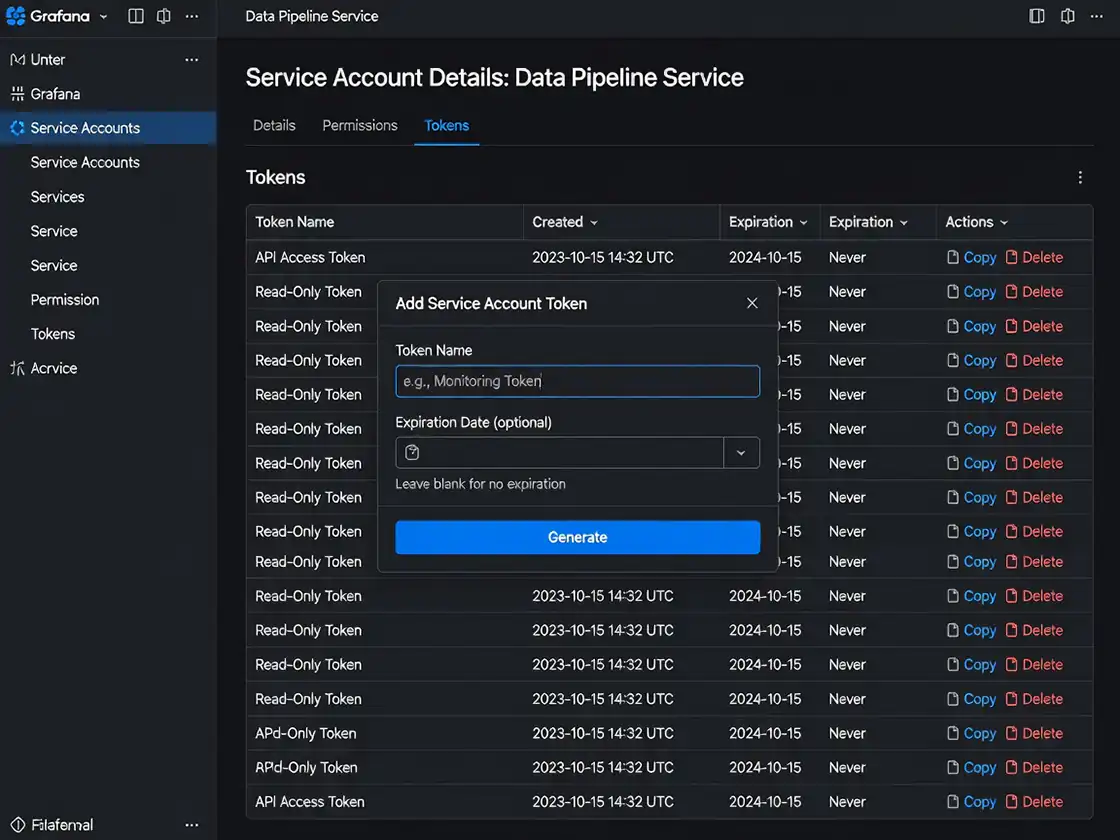
In the service account you created, click Add service account token.
Specify a token name (and an expiration date if needed), then click Generate to create the token.
ℹ️ The token is displayed only once when it is created, so copy and store it in a secure location. A Service Account Token has the same level of access as a password, so make sure it is not exposed externally. If it is exposed, delete the token and issue a new one.
Step 3. Check the Grafana Base URL#
Check the URL of the Grafana instance where annotations will be recorded.
Example:
https://grafana.company.com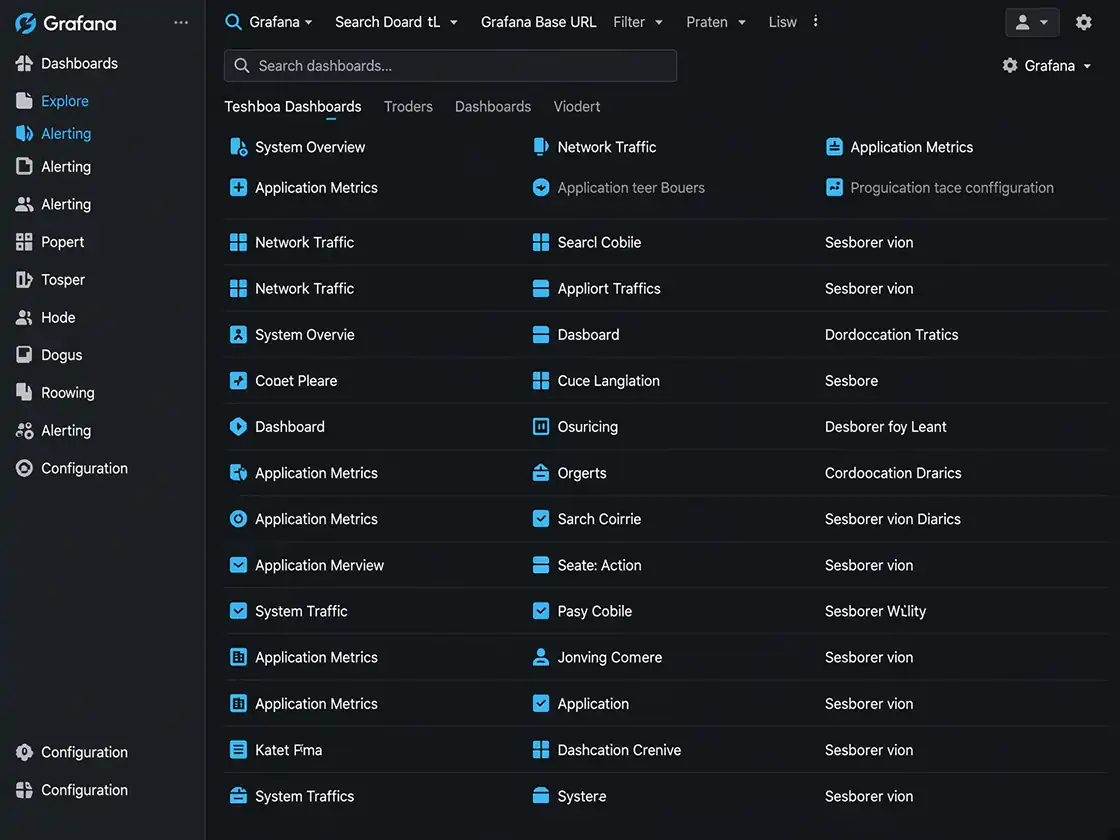
Checklist#
- ✔ A Service Account with Editor permission or higher has been created.
- ✔ A Service Account Token has been issued.
- ✔ The Grafana Base URL has been confirmed.
Configure Grafana Integration#
Enter the confirmed information in the product.
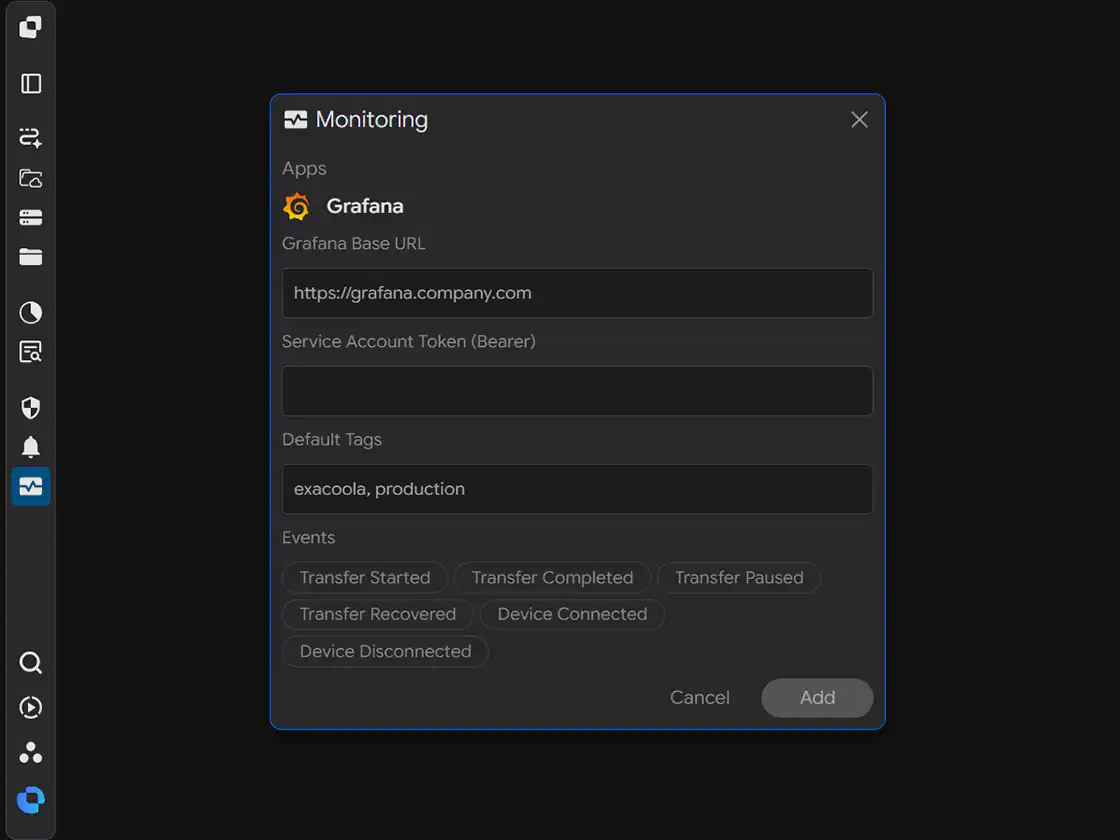
Monitoring When you open the settings window, the following screen is displayed.
Step 1. Grafana Base URL Enter#
Enter the Grafana URL in the Grafana Base URL field.
Step 2. Service Account Token Enter#
Enter the issued token in the Service Account Token (Bearer) field.
Step 3. Default Tags Enter#
Enter the default tags to use for annotations in the Default Tags field, separated by commas (,).
Example:
INNORIX, productionYou can filter annotations on the Grafana dashboard using the tags you entered.
Step 4. Select Events#
Select the events to monitor under Events.
You can select multiple events, and annotations are created in Grafana only when the selected events occur.
| Event | When It Occurs |
|---|---|
| Transfer Started | When the transfer task starts |
| Transfer Completed | When the transfer task is completed successfully |
| Transfer Paused | When the transfer task is temporarily paused |
| Transfer Recovered | When the transfer is automatically recovered and resumed after an interruption or error |
| Device Connected | When a device is connected |
| Device Disconnected | When a device is disconnected |
Step 5. Save the Settings#
After completing the input, click Add to save the integration.
Checklist#
- ✔ The Grafana Base URL has been entered.
- ✔ The Service Account Token has been entered.
- ✔ The Default Tags have been entered.
- ✔ The events to monitor have been selected.
Verify the Integration#
Verify that the settings are working correctly.
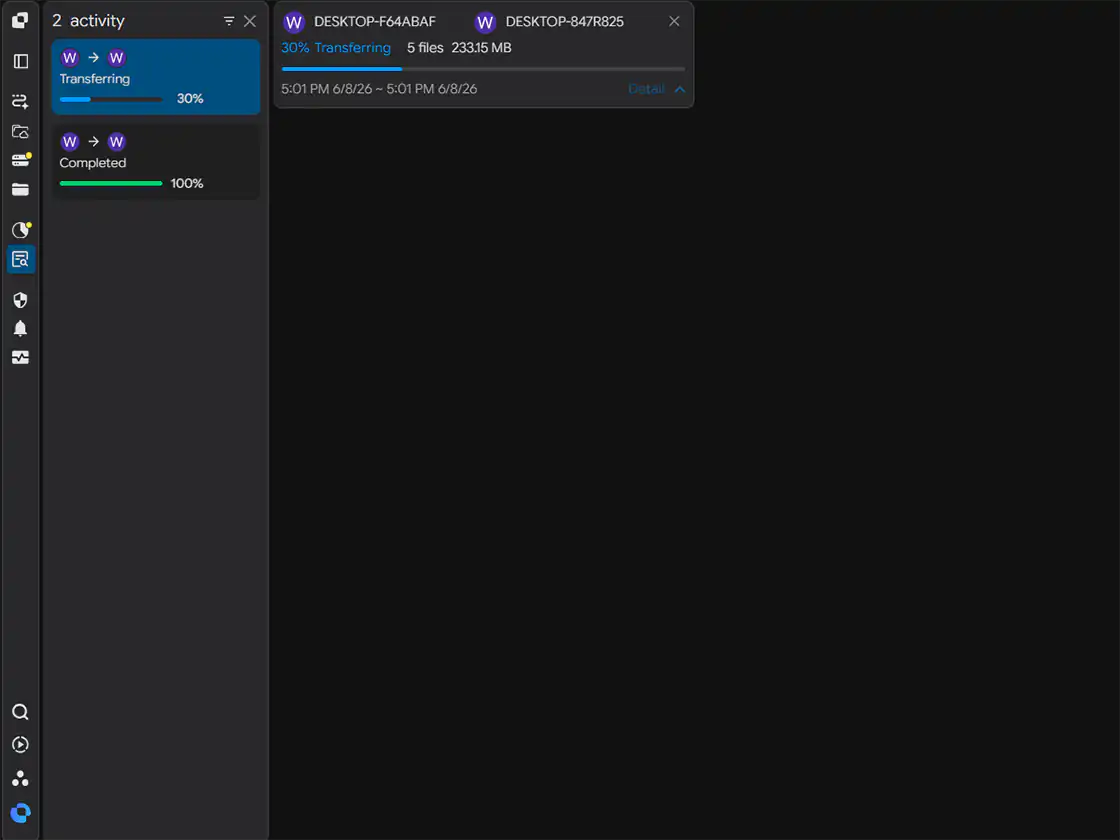
Step 1. Trigger a Test Event#
Run an actual transfer task or trigger one of the selected events.
Step 2. Check Grafana#
Check whether an annotation with the specified tags has been created on the Grafana dashboard.
Checklist#
- ✔ An annotation has been created in Grafana.
- ✔ The triggered event was delivered successfully.
Setup Complete#
Once the settings are saved, the integration is applied.
After that, an annotation is automatically created in Grafana whenever the selected events occur.
Troubleshooting#
| Issue | Checklist |
|---|---|
| An annotation is not created | Check whether the Grafana Base URL and Service Account Token are correct and whether there are leading or trailing spaces or missing characters. |
| A 401 authentication error occurs | Check whether the Service Account Token is valid and has not expired or been deleted. |
| A 403 permission error occurs | Check whether the Service Account role is Editor or higher. (Viewer cannot create annotations.) |
| Annotations are not visible on the dashboard | Check whether a Default Tags filter is configured in the dashboard's Annotation Query. |
| Connection fails | Check whether the Grafana Base URL and port are correct, and verify the network and firewall settings. |