
Overview#
You can configure HTTP Event Collector (HEC) integration to send and monitor file transfer tasks and device status changes with Splunk Cloud Platform.
After completing the integration, events are sent to Splunk whenever designated events occur, such as a transfer being Started (Transfer Started) or Completed (Transfer Completed), or a device being Connected (Device Connected) or Disconnected (Device Disconnected), allowing them to be monitored.
The entire process consists of two steps: ① Obtain an HEC Token and Check the URL → ② Configure the Integration in the Product.
Prerequisites#
Before you begin, check the following.
| Item | Description |
|---|---|
| Splunk Cloud account | A Splunk Cloud Platform account that can create an HEC Token is required. |
| Target index | The index for storing events must be created in advance. |
| Network | Outbound HTTPS communication to the HEC endpoint (http-inputs-<stack>.splunkcloud.com, 443) must be available from the environment where the product is installed. |
Obtain an HEC Token and Check the URL#
Splunk Cloud Platform collects events through HTTP Event Collector (HEC).
To send events, you need an HEC Token and an HEC URL.
Step 1. Create an HEC Token#
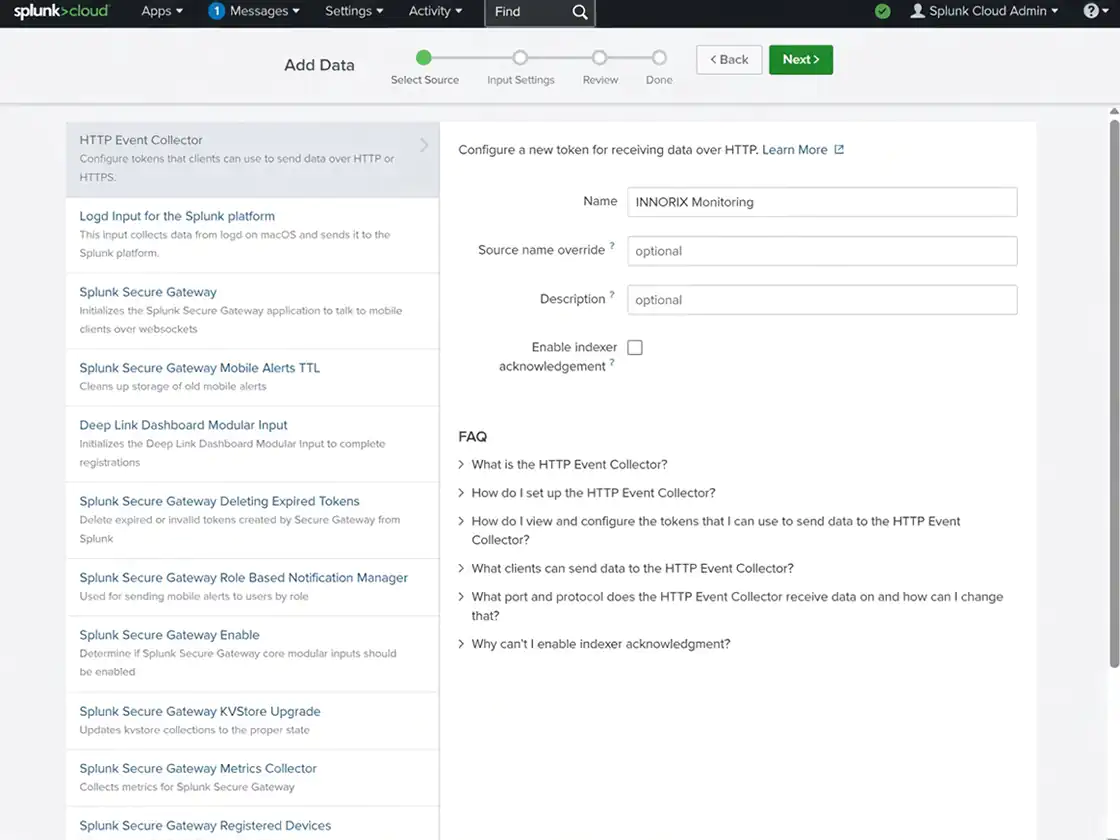
In Splunk Web, go to Settings → Data Inputs → HTTP Event Collector → New Token.
Or select Settings → Add Data → Monitor → HTTP Event Collector.
Enter a token name, select the Source Type and the index for storing events, and then create the Token.
Copy the created Token and verify that its status is Enabled.
ℹ️ An HEC Token has the same authority as a password, so make sure it is not exposed in public repositories or external documents. If it is exposed, disable or delete the Token in the HEC settings and create a new one.
Step 2. Check the HEC URL#
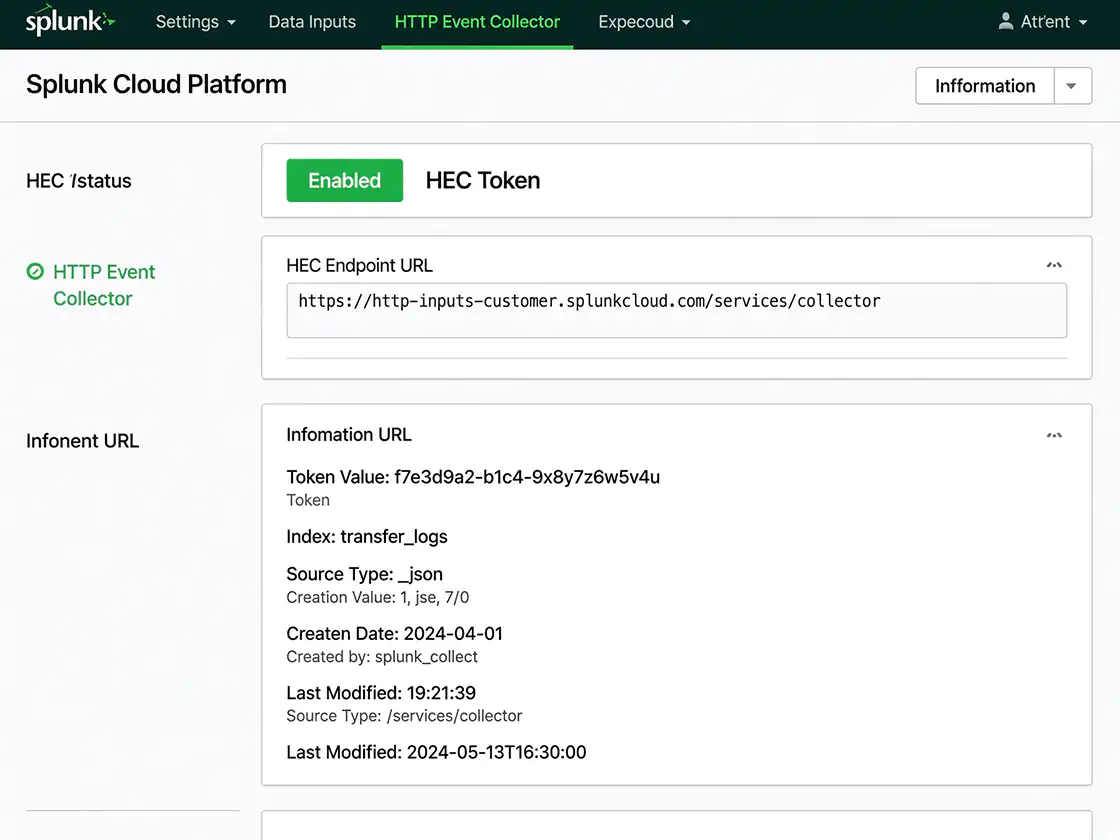
Check the HEC URL for Splunk Cloud Platform.
Example:
https://http-inputs-<stack-name>.splunkcloud.comThe event transmission path is /services/collector and uses HTTPS (443).
Checklist#
- ✔ The HEC Token has been created.
- ✔ The HEC Token is in the active (Enabled) state.
- ✔ The HEC URL has been confirmed.
Configure Splunk Cloud Platform Integration#
Enter the confirmed HEC URL and Token in the product.
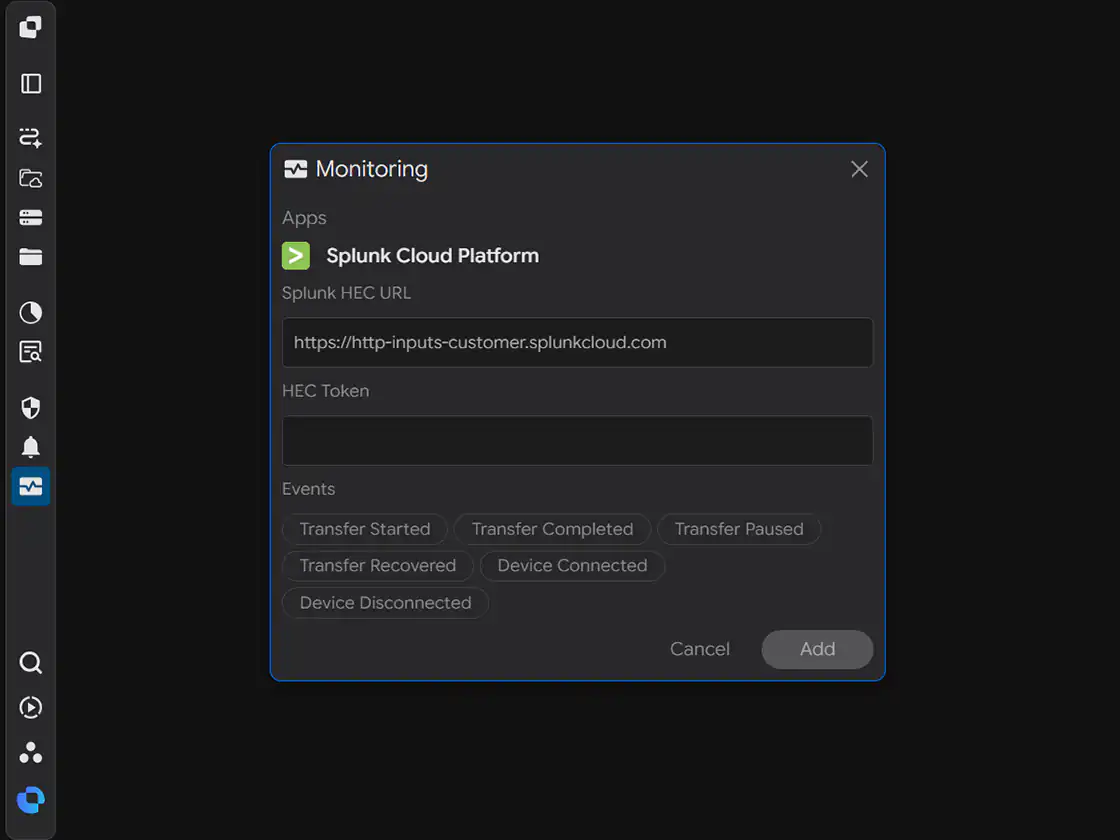
When you open the Monitoring settings window, the following screen is displayed.
Step 1. Enter the Splunk HEC URL#
Enter the HEC URL in the Splunk HEC URL field.
Example:
https://http-inputs-customer.splunkcloud.comStep 2. Enter the HEC Token#
Enter the created Token in the HEC Token field.
Step 3. Select Events#
Select the events to monitor under Events.
You can select multiple events, and events are sent to Splunk only when the selected events occur.
| Event | When It Occurs |
|---|---|
| Transfer Started | When the transfer task starts |
| Transfer Completed | When the transfer task is completed successfully |
| Transfer Paused | When the transfer task is temporarily paused |
| Transfer Recovered | When the transfer is automatically recovered and resumed after an interruption or error |
| Device Connected | When a device is connected |
| Device Disconnected | When a device is disconnected |
Step 4. Save the Settings#
After completing the input, click Add to save the integration.
Checklist#
- ✔ The Splunk HEC URL has been entered.
- ✔ The HEC Token has been entered.
- ✔ The events to monitor have been selected.
Verify the Integration#
Verify that the settings are working correctly.
Step 1. Trigger a Test Event#
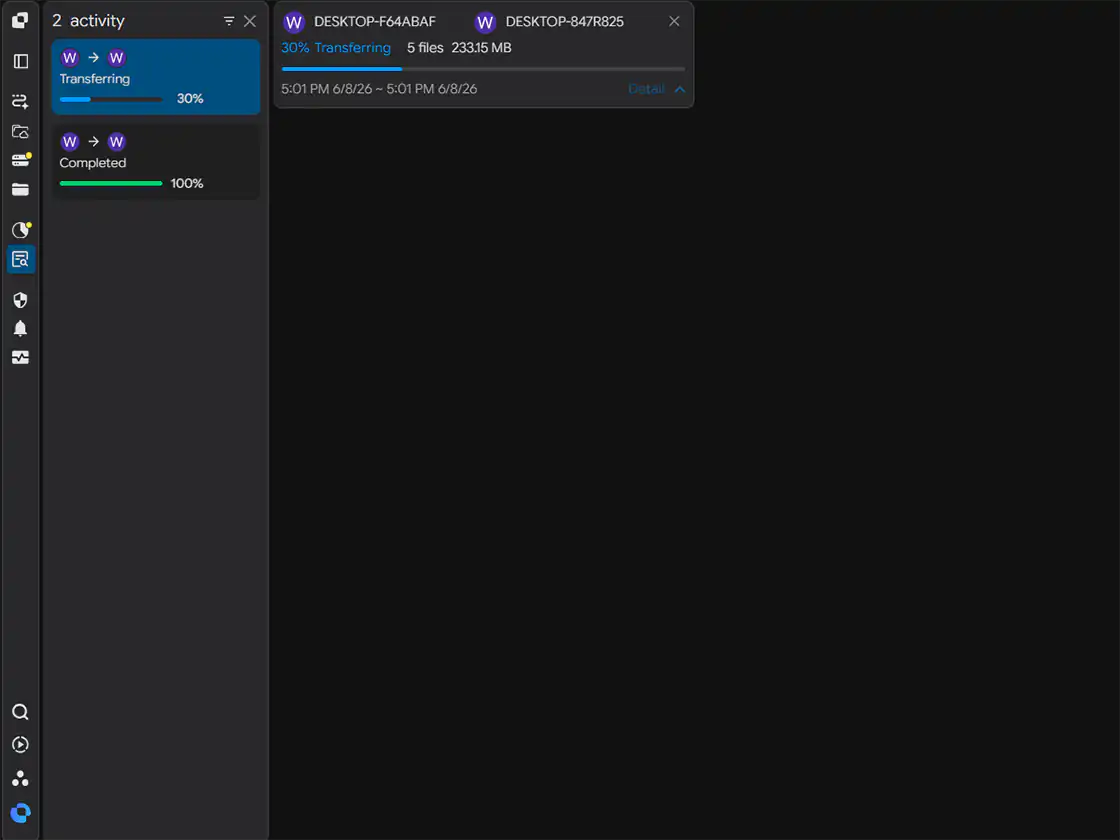
Run an actual transfer task or trigger one of the selected events.
Step 2. Check Splunk#
Search the target index in Splunk Search to verify that events have been collected successfully.
Example:
index=<index-name>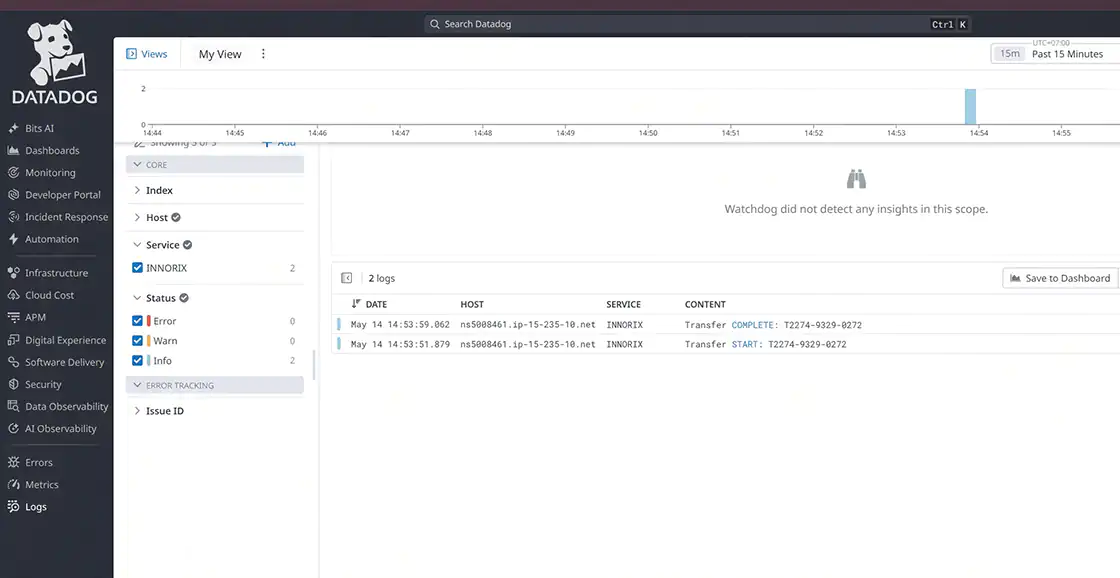
Checklist#
- ✔ An event has been collected in Splunk.
- ✔ The triggered event was delivered successfully.
Setup Complete#
Once the settings are saved, the integration is applied.
After that, an event is automatically sent to Splunk whenever the selected events occur.
Troubleshooting#
| Issue | Checklist |
|---|---|
| Events are not collected | Check whether the Splunk HEC URL and HEC Token are correct and whether there are leading or trailing spaces or missing characters. |
| The HEC Token is not working | Check whether the Token is Enabled and deployment has been completed. |
| An authentication error occurs | Check whether the HEC Token is correct. |
| An index error occurs | Check whether the index specified for the Token exists. |
| Connection fails | Check whether the HEC endpoint (http-inputs-<stack>.splunkcloud.com, 443) is allowed by the firewall or proxy. |