
Getting Started#
Basic Concept#
Connect file transfer status to Datadog events and the monitoring environment
File transfer operations can have different statuses, including completed, in progress, and failed, depending on the execution result.
For automatically executed Flows in particular, operators may not be able to check the status manually every time an operation starts, so status information can be sent to the existing monitoring environment when an issue occurs.
The overall flow can be connected as follows.
File Transfer Flow
        │
        ▼
Run Started
        │
        ├───────────────┐
        ▼               │
Transfer Processing     │
        │               │
        ├── Completed ──┼──▶ Normal Result
        │               │
        └── Failed ─────┘
                │
                ▼
          Datadog Event
                │
                ▼
             Monitor
                │
                ▼
        Alert / Recovery Check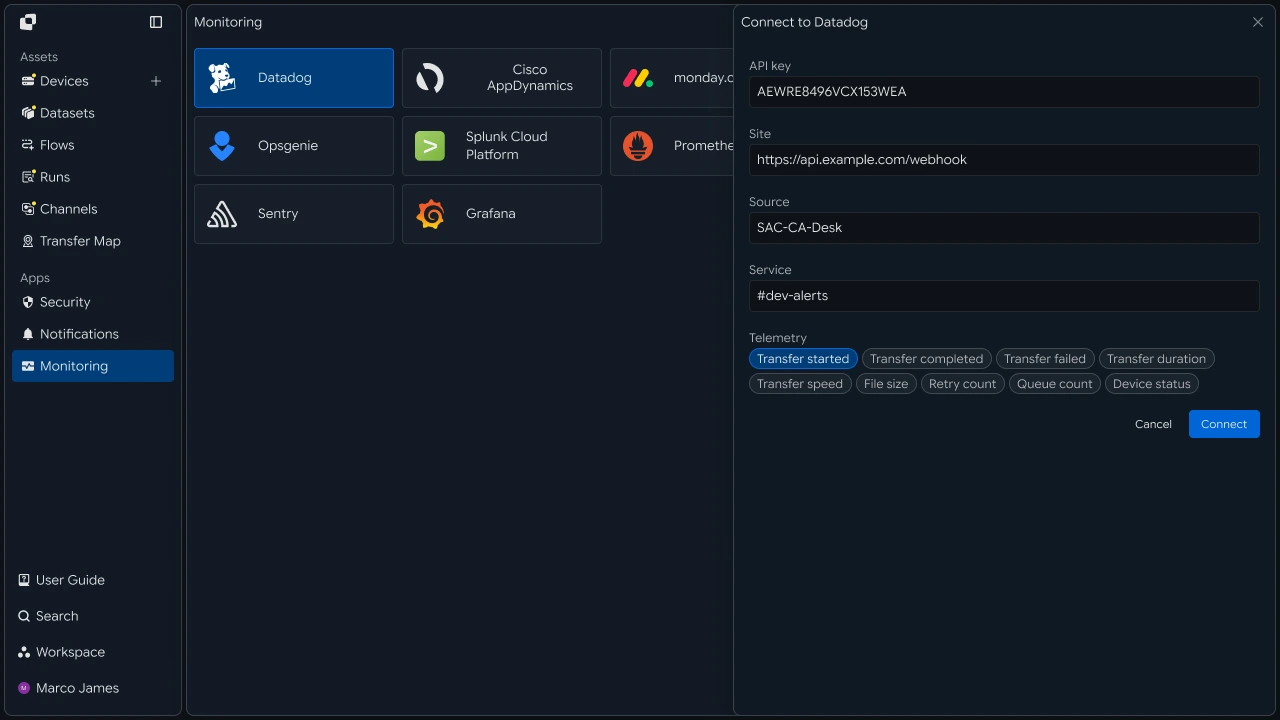
This connects transfer execution → status change → Datadog event → monitor check → recovery result verification as a single operational flow instead of checking the file transfer system and monitoring environment separately.
Alert Flow#
Detect failed Runs and continue with the required operational checks
When an issue occurs in a transfer operation, first determine whether it failed based on the Run status.
When a failed Run is detected, relevant information is sent to Datadog, where the issue can be identified through events and monitors.
For example, the flow can be configured as follows.
| Transfer Status | Datadog Processing | Operational Check |
|---|---|---|
| Started | Record execution event | Confirm operation start |
| Running | Check status when needed | Check progress status |
| Failed | Send failure event | Check monitor and alert |
| Retrying | Send retry status | Check recovery progress |
| Completed | Send completion or recovery event | Check final result |
When a retry occurs after a failure, the same flow can be used not only to retain the failure alert but also to verify whether the affected Run subsequently recovered successfully.
Transfer Failed
       │
       ▼
Datadog Event
       │
       ▼
Failure Monitor
       │
       ▼
Run Investigation
       │
       ▼
Retry
       │
       ├── Failed ──────▶ Additional Alert
       │
       └── Completed ───▶ Recovery Event
This allows operators to review the complete status changes of a transfer operation without separating the initial failure from the subsequent recovery status.
Operational Changes#
Manage file transfer results together with system monitoring
The method used to check file transfer results can vary by operating environment.
Status can be checked directly in the transfer system's Runs screen, but environments operating multiple servers, services, and applications may need file transfer status to be visible in the existing monitoring tool as well.
| Category | Individual Check | Datadog Integration |
|---|---|---|
| Status check | Check directly in the transfer screen | Check together in events and monitors |
| Failure detection | Identify issue after checking Run | Send to operating environment when failure occurs |
| Recovery check | Check rerun results again | Check recovery status and final result |
| Operational scope | Focused on file transfer | Monitor together with services and infrastructure |
| History management | Check transfer execution records | Use event flow and monitoring records |
Datadog integration does not replace the file transfer function itself. Instead, it can be used to bring important file transfer status changes into the existing operational and monitoring flow.
IT Engineer#
Event Connection#
Send Transfer Flow status changes to Datadog
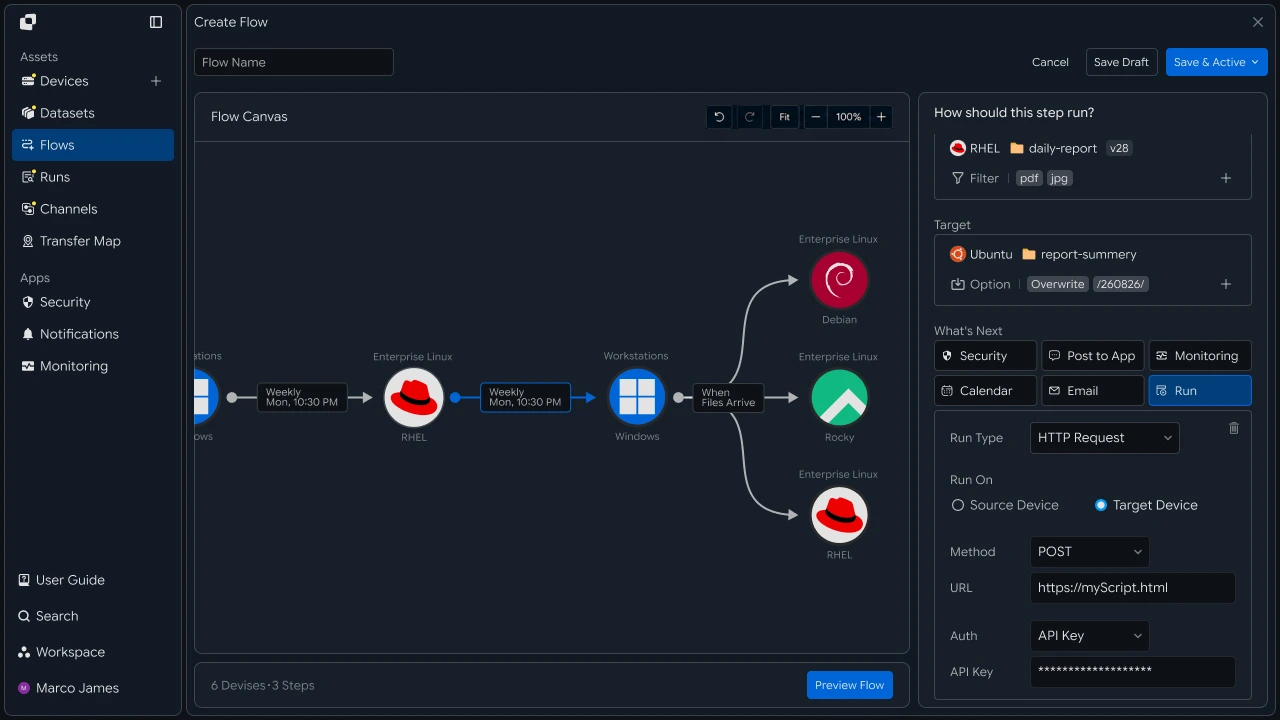
First, configure the event delivery path between the file transfer operation and Datadog.
Required status information can be sent to the external monitoring environment as a transfer starts, fails, retries, or completes.
┌─────────────────────┐
│    Transfer Flow    │
└──────────┬──────────┘
           │
           │ Run Status
           ▼
┌─────────────────────┐
│   Event Condition   │
│                     │
│ Failed / Retrying   │
│ Completed           │
└──────────┬──────────┘
           │
           ▼
┌─────────────────────┐
│       Datadog       │
│                     │
│ Event / Monitor     │
└─────────────────────┘
All execution statuses can be sent in the same way, but in actual operations the integration can focus on statuses that require attention.
For example, only failure and retry statuses can be sent to Datadog, while normal completions are recorded only under separate conditions.
Status Filtering#
Separate and send failure and recovery events required for operations
Sending every file transfer event in the same way can create unnecessary information in the operating environment.
Events that actually require monitoring can therefore be selected based on transfer status and processing results.
For example, they can be separated as follows.
Run Status
    │
    ├── Started
    │      └── Event Record
    │
    ├── Failed
    │      └── Datadog Alert Event
    │
    ├── Retrying
    │      └── Recovery Progress
    │
    └── Completed
           │
           ├── Normal Completion
           │
           └── Recovery Completed
                  └── Recovery Event
Failure events can include the information required to identify the transfer operation and investigate the cause.
| Delivered Information | Usage |
|---|---|
| Flow name | Identify which transfer operation generated the event |
| Run status | Distinguish failure, retry, completion status |
| Source | Check the system and path files are retrieved from |
| Target | Check the target environment where files are stored |
| Occurrence time | Check when the issue occurred |
| File information | Identify the transfer target affected by the issue |
| Execution result | Check failure cause and processing status |
With this configuration, after reviewing a Datadog event you can return to the transfer operation details when needed and continue investigating where the issue occurred.
Monitor Configuration#
Monitor repeated or persistent transfer failures
A single file transfer failure can occur because of a temporary network issue or the state of the target environment.
However, additional investigation may be required if failures repeat in the same Flow or no successful transfer result occurs for a certain period.
Datadog can therefore use the delivered events to configure a monitoring flow for identifying repeated failure patterns.
Transfer Events
       │
       ▼
Failed Events
       │
       ▼
┌───────────────────┐
│ Failure Pattern   │
│                   │
│ • Single Failure  │
│ • Repeated Failure│
│ • Continuous Fail │
└─────────┬─────────┘
          │
          ▼
       Monitor
          │
          ▼
    Operational Alert
[ProductUI_screen connecting repeated file transfer failure events to Datadog monitoring conditions]
Monitoring criteria can be defined according to actual operating practices.
| Situation | Example Monitoring Criteria | Response |
|---|---|---|
| Single failure | Specific Run failure occurs | Check detailed results |
| Repeated failure | Consecutive failures in the same Flow | Check Source, Target environments |
| Long-running incomplete | Not completed within a set time | Check execution status |
| Repeated retries | Failure continues after Retry | Adjust transfer environment |
| Recovery complete | Successful completion after failure | Check recovery result |
This allows operational priorities to be distinguished based on recurrence and recovery status instead of treating every failure with the same importance.
Recovery Verification#
Verify successful transfer completion after a retry
After a file transfer failure, the environment may be adjusted or an automatic retry may run.
Because the initial failure event alone does not show whether the issue was actually resolved, the new Run result after the retry can also be checked.
① Failure Detected
        │
        ▼
② Datadog Event
        │
        ▼
③ Check Run Details
        │
        ▼
④ Check Source / Target
        │
        ▼
⑤ Retry
        │
        ▼
⑥ New Run
        │
        ├── Failed
        │      │
        │      └────▶ Failure Event
        │
        └── Completed
               │
               ▼
          Recovery Event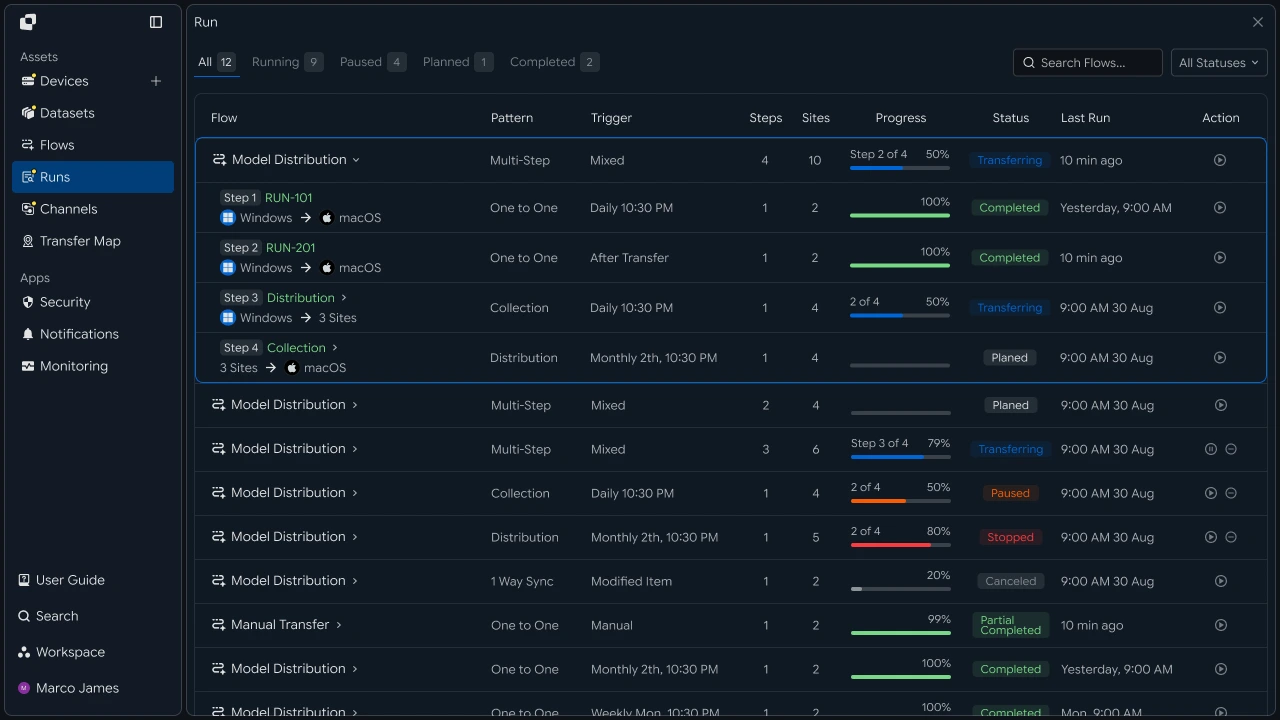
For example, if the Source system temporarily loses its connection, check the connection status and then retry.
If there was an issue with Target storage access or the storage path, adjust that environment, run a new Run, and verify that the files were ultimately applied successfully.
This manages failure detection → cause investigation → environment adjustment → retry → recovery completion verification as a single operational flow.
Result Tracking#
Identify where an issue occurred by checking the transfer Run together with Datadog events
When an issue requires action, review the event in Datadog and then use the Run details for the relevant file transfer operation to check processing results.
In the Run, you can check which Source the files came from, which Target they were transferred to, and where additional verification is required among the transferred files.
Datadog Alert
      │
      ▼
Transfer Flow
      │
      ▼
Run Details
      │
      ├── Source Status
      │
      ├── Target Status
      │
      ├── File Results
      │
      └── Activity History
              │
              ▼
        Problem Location
The following items can be reviewed together during investigation.
| Item | Details |
|---|---|
| Run status | Failure, retry, completion status |
| Source | Source system and file path |
| Target | Target storage and storage location |
| File results | Processing status for successful and failed files |
| Execution time | Issue occurrence and recovery time |
| Activity | Execution process and status-change history |
Using Datadog events together with Run details allows you not only to confirm that a transfer failed, but also to track where in the transfer the issue occurred and whether it subsequently recovered successfully.
Operational Response#
Manage transfer failure and recovery status in the existing monitoring environment
When a file transfer fails, identify the issue through Datadog events or monitors and investigate the cause through Run details in the actual file transfer environment.
Source and Target can be checked separately depending on where the issue occurred.
                    Transfer Failure
                           │
                           ▼
                    Datadog Monitor
                           │
                           ▼
                     Run Details
                           │
                ┌──────────┴──────────┐
                ▼                     ▼
          Source Check           Target Check
                │                     │
        Connection / Path      Storage / Permission
                │                     │
                └──────────┬──────────┘
                           ▼
                    Environment Fix
                           │
                           ▼
                         Retry
                           │
                           ▼
                    New Run Result
                           │
                ┌──────────┴──────────┐
                ▼                     ▼
             Failed               Completed
                │                     │
                ▼                     ▼
          Failure Event         Recovery Event
With this guide, you can configure file transfer execution → detect status changes → send Datadog events → monitor failures → check Run details → inspect Source, Target → retry → verify recovery event as a single operational flow.
Instead of checking file transfer execution results separately, this allows you to connect transfer failures, repeated errors, retries, and successful recovery results to the existing Datadog monitoring environment and manage file transfer operational status together.
Developer#
Register an integration to automatically send transfer failure and recovery events to Datadog
Register the Datadog integration once and enable the events to send. Check the configuration fields for the Datadog type with GET /api/integrations/rules/datadog. Prepare the following before starting.
| Prerequisite | Details |
|---|---|
| INNORIX authentication | INNORIX_ACCESS_TOKEN (Authorization: Bearer) |
| Datadog configuration | Configuration values required by the Datadog type rules (GET /api/integrations/rules/datadog) (API Key, Site, etc.) |
| Event selection | Events to send: error (failure), recovered, completed, etc. |
| Runtime | Python 3 + requests, Java 17+, Node.js 18+, .NET 8+ |
Python and Node.js reuse the minimal
api()helper for direct REST calls from the API Call Recipe. Java and C# use the bundledInnorixClientandJsonhelper (Jfor C#). Follow the response fromGET /api/integrations/rules/datadogfor the exact Datadog integration configuration field names.
Register Datadog Integration#
Create the integration with type: "datadog" and enable the events to send in notificationConfig.events. Put Datadog configuration values (API Key, Site, etc.) in config according to the rules.
def create_datadog_alert(name, config, events=("error", "recovered")):
    # config: values required by GET /api/integrations/rules/datadog (e.g. apiKey, site)
    result = api("POST", "/api/integrations", {
        "name": name,
        "type": "datadog",
        "category": "monitoring",
        "config": config,
        # enabled events are delivered automatically for every transfer/automation in the workspace
        "notificationConfig": {"events": {e: True for e in events}},
    }) or {}
    return result.get("integrationId")


integration_id = create_datadog_alert(
    "transfer-failures",
    {"apiKey": "<DATADOG_API_KEY>", "site": "datadoghq.com"},
    events=("error", "recovered"))
print("Datadog integration:", integration_id)
static String createDatadogAlert(InnorixClient client, String name,
Map<String, Object> config, List<String> events) {
Map<String, Object> eventMap = new LinkedHashMap<>();
for (String e : events) eventMap.put(e, true); // enabled events are delivered automatically across the workspace
Map<String, Object> result = client.apiObj("POST", "/api/integrations", Json.newObj(
"name", name,
"type", "datadog",
"category", "monitoring",
"config", config,
"notificationConfig", Json.newObj("events", eventMap)), null);
return Json.str(result, "integrationId");
}async function createDatadogAlert(name, config, events = ["error", "recovered"]) {
const eventMap = {};
for (const e of events) eventMap[e] = true; // enabled events are delivered automatically across the workspace
const result = (await api("POST", "/api/integrations", {
name,
type: "datadog",
category: "monitoring",
config, // config values per the GET /api/integrations/rules/datadog rules
notificationConfig: { events: eventMap },
})) || {};
return result.integrationId;
}
const integrationId = await createDatadogAlert(
"transfer-failures",
{ apiKey: "<DATADOG_API_KEY>", site: "datadoghq.com" },
["error", "recovered"]);
console.log("Datadog integration:", integrationId);static async Task<string> CreateDatadogAlertAsync(InnorixClient client, string name,
JsonObject config, IEnumerable<string> events = null)
{
var eventMap = new JsonObject();
foreach (var e in events ?? new[] { "error", "recovered" }) eventMap[e] = true;
var result = await client.ApiObjAsync("POST", "/api/integrations", new JsonObject
{
["name"] = name,
["type"] = "datadog",
["category"] = "monitoring",
["config"] = config, // config values per the GET /api/integrations/rules/datadog rules
["notificationConfig"] = new JsonObject { ["events"] = eventMap },
}) ?? new JsonObject();
return J.Str(result, "integrationId");
}Configuration fields follow the rules Check required settings by type with
GET /api/integrations/rules/datadog. Theconfigkeys in the example are illustrative, so populate them according to the rules response. If required settings are missing, events may not be delivered even if the integration is created.
API Key storage Do not put the Datadog API Key directly in code as shown in the example. Read it from an environment variable or Secret store and inject it into
config.
Events apply workspace-wide Events enabled in
notificationConfig.eventsapply to all transfers and automations in the workspace. The integration is not attached to each transfer, andintegrationIdis not passed to/api/transfers/manual. Valid events:started,completed,paused,resumed,recovered,canceled,error(failure),skipped; monitoring integrations also receivedeviceConnected,deviceDisconnected.
Implementation Result#
With this recipe, transfer events can be sent to Datadog using the following flow.
Transfer, automation events (error / recovered, etc.)
   ↓  Automatic notification across the workspace
INNORIX Datadog integration
   ↓
Datadog events, monitors, alerts
Once the Datadog integration is registered and the events to send are enabled, transfer failure and recovery events are automatically sent to Datadog across the entire workspace.