
Overview#
You can configure an Elastic Stack integration to index file transfer activities and device status changes into Elasticsearch for monitoring.
Once configured, whenever a selected event occurs—such as Transfer Started, Transfer Completed, Device Connected, or Device Disconnected—the event is indexed into Elasticsearch and can be monitored through Kibana or other Elastic Stack tools.
The overall process consists of the following steps:
① Prepare Elasticsearch Connection Information and Authentication → ② Configure the Integration in the Product
Prerequisites#
Before you begin, verify the following requirements.
| Item | Description |
|---|---|
| Elastic Stack | An Elasticsearch cluster (and optionally Kibana) where events will be indexed. |
| Authentication | Either an API Key or a user account with write permission to the target index is required. |
| Network | The environment where the product is installed must be able to access the Elasticsearch endpoint (default port 9200). |
Prepare Elasticsearch Connection Information and Authentication#
To index events into Elasticsearch, you need the Elasticsearch URL and authentication information.
Authentication can be performed using either an API Key or Username/Password.
Step 1. Verify the Elasticsearch URL#
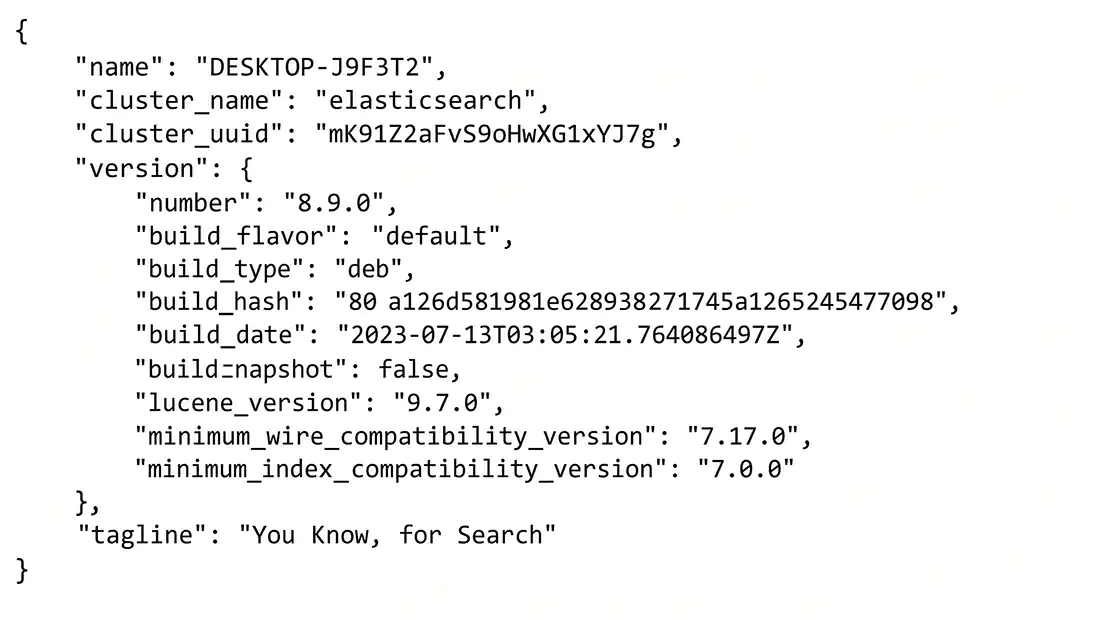
Verify the connection URL of the Elasticsearch cluster where events will be indexed.
In a self-managed environment, the URL typically uses the following format:
https://localhost:9200Use the appropriate host name and port for your environment.
Step 2. Generate an API Key (Recommended)#
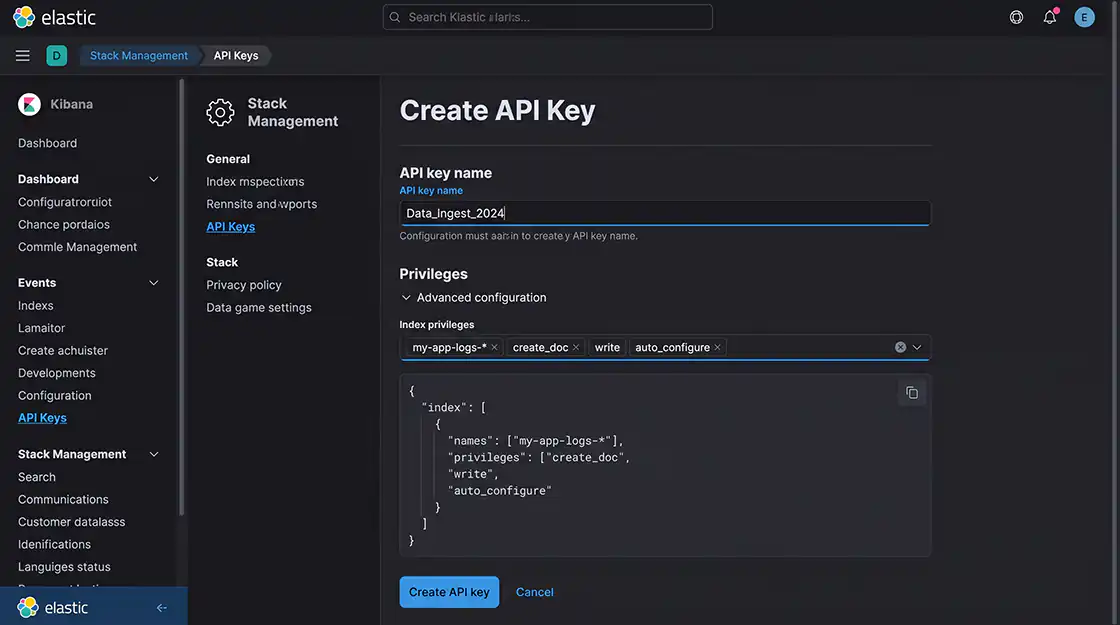
In Kibana, navigate to Stack Management → API Keys, then click Create API Key.
To index events, the API Key requires create_doc or write privileges on the target index. If the index will be created automatically, the auto_configure privilege is also required.
Copy the generated API Key.
Treat the API Key like a password. Do not expose it in public repositories or external documentation.
If the key is compromised, invalidate it from Kibana.
Step 3. Prepare a User Account (Optional)#
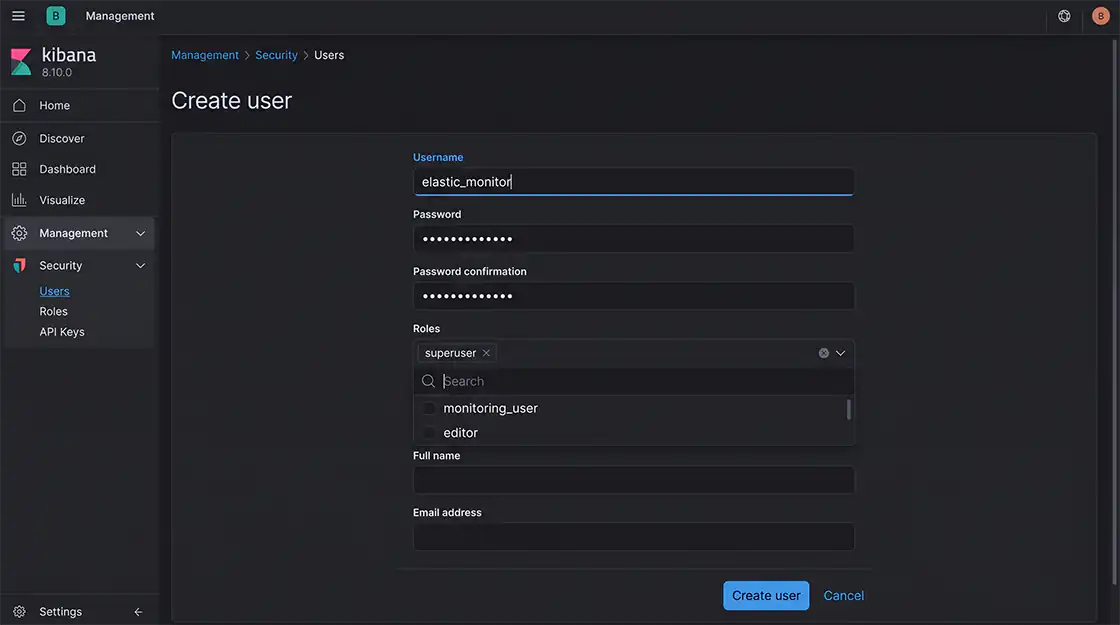
If you choose to authenticate with a user account instead of an API Key, prepare a Username and Password with write permission to the target index.
This step is not required when using an API Key.
Verification#
✔ The Elasticsearch URL has been verified.
✔ An API Key or Username/Password has been prepared.
Configure the Elastic Stack Integration#
Enter the connection and authentication information into the product.
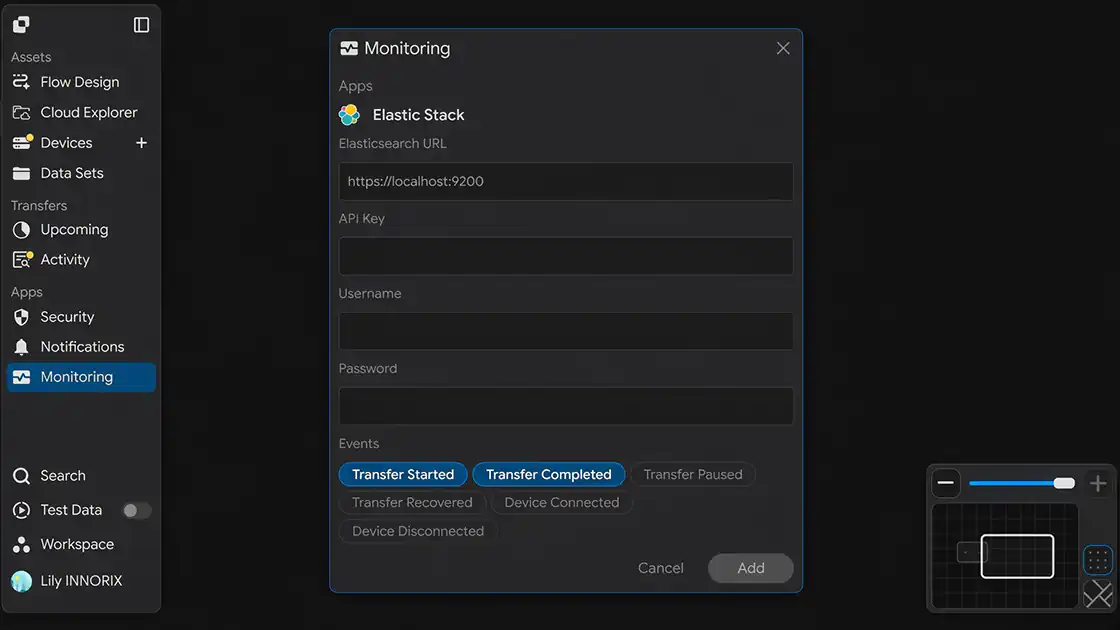
When you open the Monitoring configuration page, the following screen is displayed.
Step 1. Enter the Elasticsearch URL#
Enter the Elasticsearch connection URL verified in the "Prepare Elasticsearch Connection Information and Authentication" section into the Elasticsearch URL field.
Example:
https://localhost:9200Step 2. Enter Authentication Information#
Select one of the following authentication methods.
API Key
- Enter the generated API Key.
Username / Password
- Enter the Username and Password.
Only one authentication method is required.
Step 3. Select Events#
Select the events to monitor.
Multiple events can be selected. Only the selected events will be indexed into Elasticsearch.
| Event | Trigger |
|---|---|
| Transfer Started | When a Transfer begins. |
| Transfer Completed | When a Transfer completes successfully. |
| Transfer Paused | When a Transfer is paused. |
| Transfer Recovered | When a Transfer automatically resumes after an interruption or failure. |
| Device Connected | When a device connects. |
| Device Disconnected | When a device disconnects. |
Step 4. Save the Configuration#
After completing the configuration, click Add to save the integration.
Verification#
✔ The Elasticsearch URL has been entered.
✔ Authentication information (API Key or Username/Password) has been entered.
✔ The monitoring events have been selected.
Verify the Integration#
Verify that the integration is operating correctly.
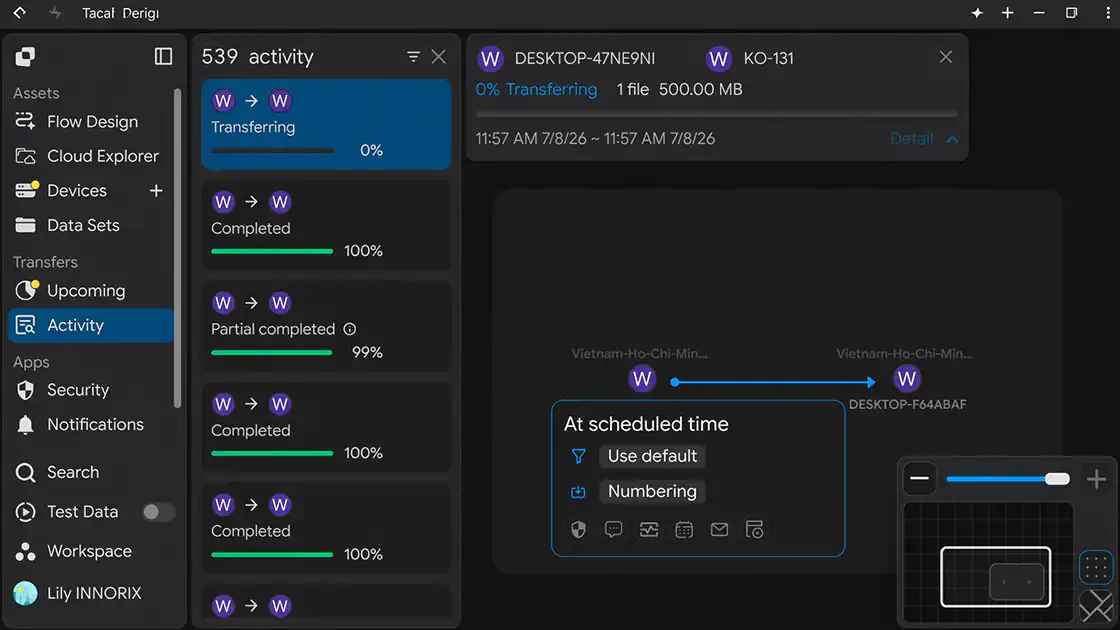
Step 1. Generate a Test Event#
Start a Transfer or trigger one of the selected monitoring events.
Step 2. Verify in Elasticsearch or Kibana#
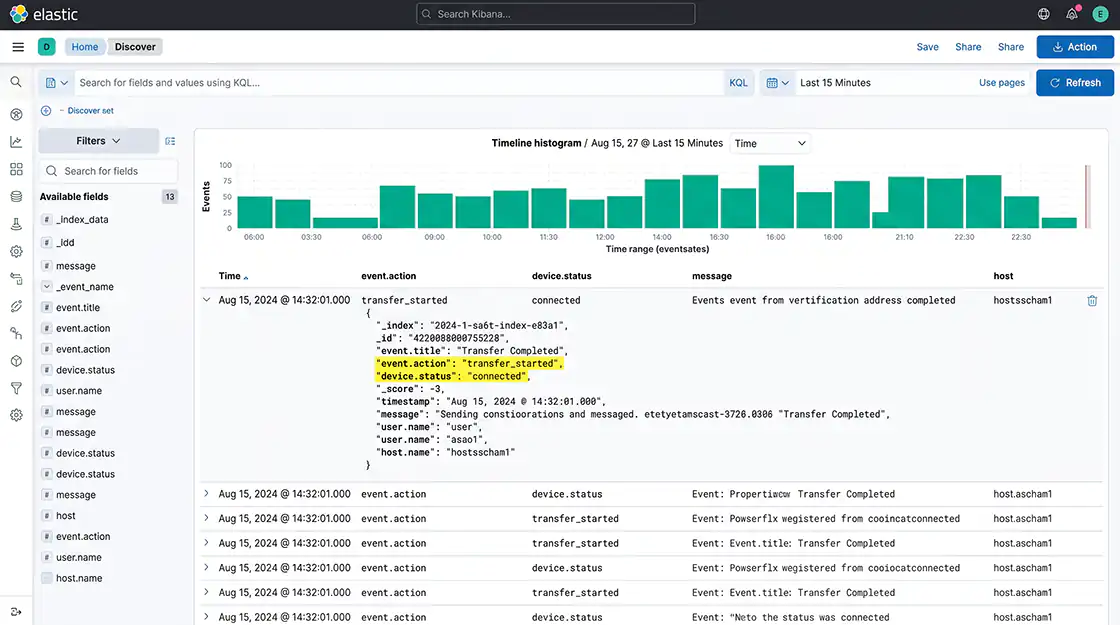
Use Kibana or search the Elasticsearch index to verify that the event has been indexed successfully.
Verification#
✔ The event has been indexed into Elasticsearch.
✔ The generated event has been delivered successfully.
Configuration Complete#
After the configuration is saved, the integration becomes active.
From this point forward, whenever one of the selected events occurs, the corresponding event is automatically indexed into Elasticsearch.
Troubleshooting#
| Issue | Verification |
|---|---|
| Events are not indexed | Verify that the Elasticsearch URL and authentication information (API Key or Username/Password) are correct and contain no leading or trailing spaces. |
| Authentication error (401) | Verify that the API Key has not been invalidated or expired, or that the Username and Password are correct. |
| Permission error (403) | Verify that the authentication credentials have the required create_doc, write, and auto_configure privileges for the target index. |
| TLS certificate error | If using a self-signed certificate, verify that the certificate is trusted by the product. |
| Connection failure | Verify that the Elasticsearch URL and port (default 9200) are correct and that access is allowed by the firewall or network policy. |