
Getting Started#
Basic Concept#
Monitor the execution status of multiple file transfer Flows in one dashboard
In a file transfer environment, multiple operations can run simultaneously, including server-to-server transfers, cloud storage movement, automated collection, and distribution.
The result of each operation can be checked individually in Runs, but reviewing the overall operational status may require comparing multiple execution results one by one.
A Grafana dashboard lets you monitor key statuses and metrics from transfer operations together over time.
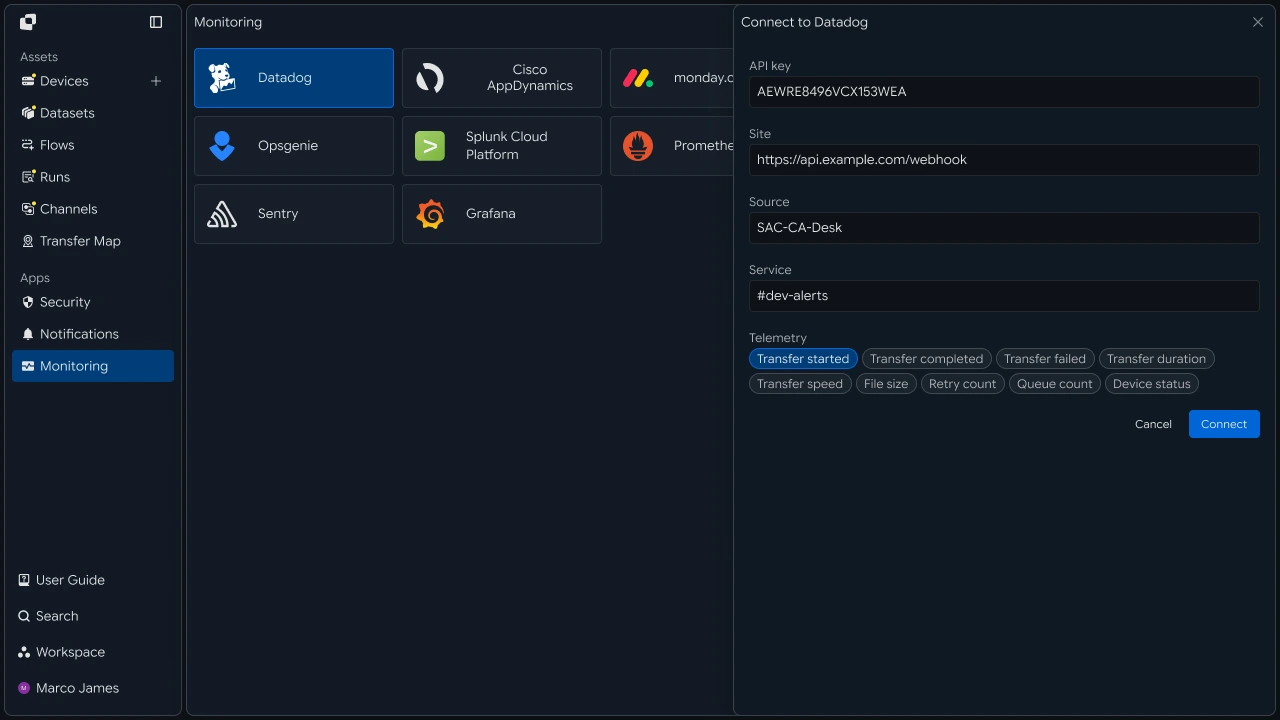
This creates an operational flow from overall transfer status → specific Flow status → individual Run review instead of checking each transfer operation separately.
Dashboard Configuration#
Separate transfer volume and status metrics according to purpose
Instead of displaying all information in one panel, a Grafana dashboard can separate the items that need to be monitored during operations according to their role.
For example, current transfer status can be checked quickly at the top, while transfer-volume changes and failure trends over time can be reviewed in separate panels.
An example dashboard configuration is shown below.
| Dashboard Area | Metrics | Usage |
|---|---|---|
| Current status | Runs in progress, overall progress | Check current transfer status |
| Transfer volume | File count, total transfer size | Check processing scale and changes |
| Completion status | Number of completed Runs | Check successful processing results |
| Failure status | Number of failed Runs | Check whether issues occurred |
| Retry | Retry count and status | Check recovery operations |
| Trend analysis | Transfer volume and status changes over time | Check recurring patterns |
| Flow comparison | Success and failure results by Flow | Compare specific operation status |

Separating current status, cumulative results, and changes over time allows operators to quickly find the information needed for the situation they are reviewing.
Operational Flow#
Check overall status in the dashboard, then move to the required Run
Grafana can be used to quickly review the status of the overall transfer environment. If an issue is found, you can move to the relevant Flow and Run details to check the actual transfer results.
The overall flow can be configured as follows.
For example, if the dashboard shows an increase in failures during a specific period, you can identify the relevant Flow and check the Source, Target, and per-file processing results in the Run details.
This allows you to manage overall status in Grafana, then actual file transfer results and cause investigation in the Run details screen.
IT Engineer#
Metric Connection#
Connect file transfer execution results to monitoring data
First, send execution information and status changes available from the file transfer Flow as monitoring metrics.
Connecting status changes such as completion, failure, and retry along with transfer volume and file count makes it possible to monitor the operational state of the file transfer environment, not just usage.
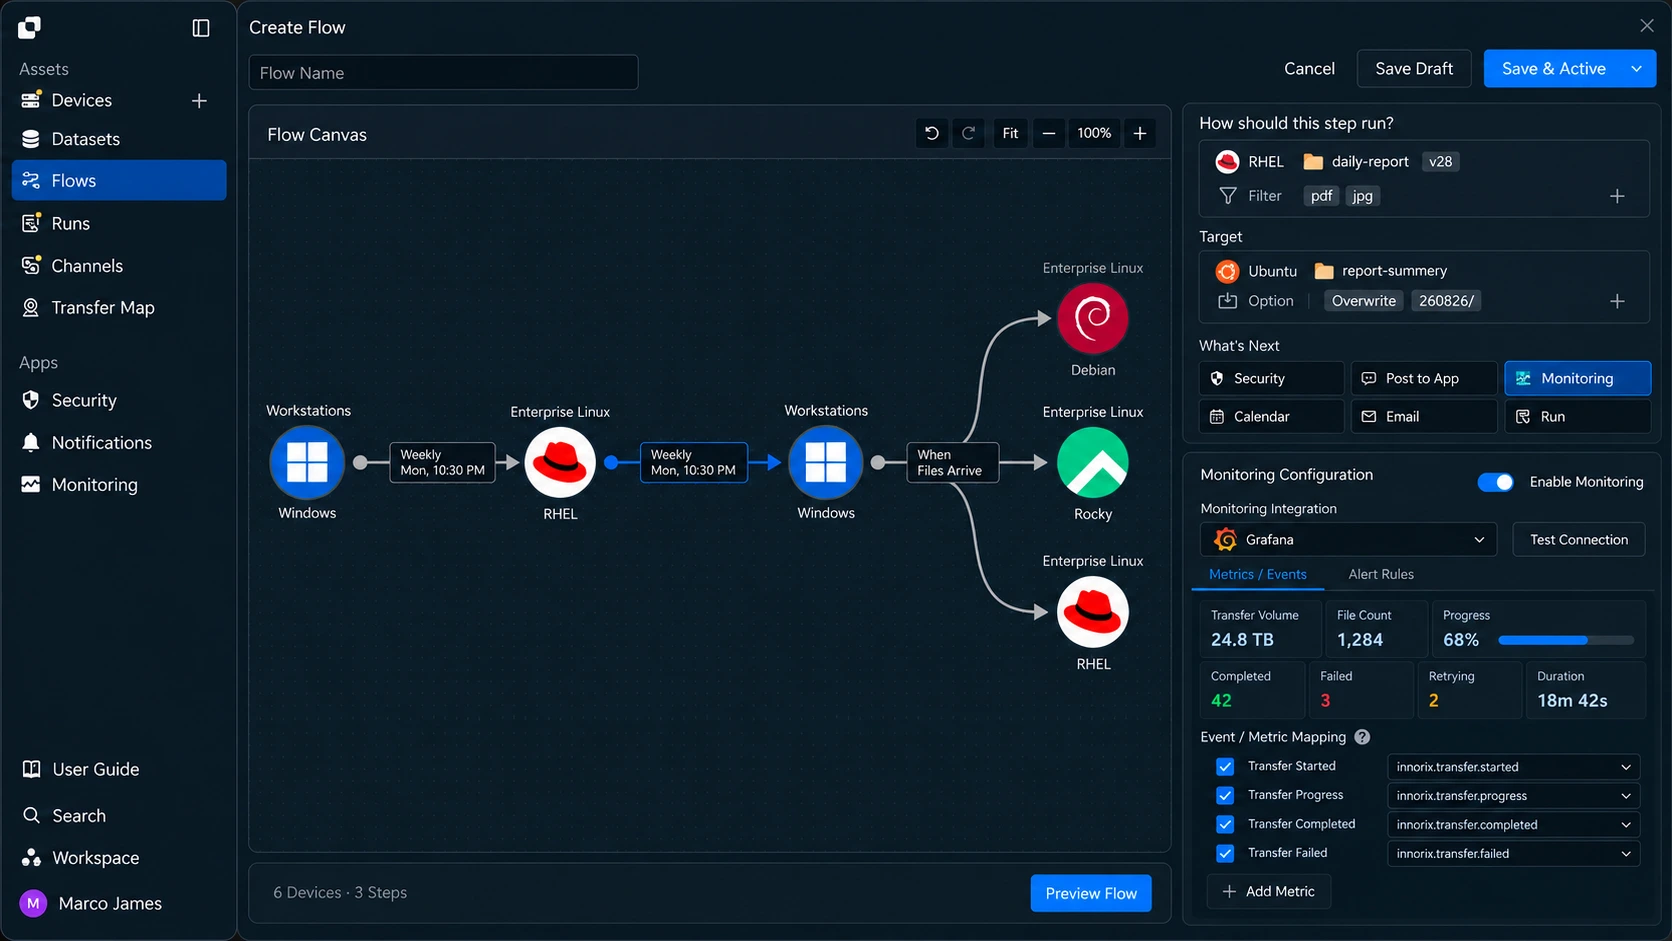
The transfer environment can be configured around metrics such as the following.
| Metric | Details |
|---|---|
| Transfer Volume | Total transfer volume processed during a specified period |
| File Count | Number of transferred files |
| Progress | Progress of operations currently running |
| Completed | Number of successfully completed operations |
| Failed | Number of failed operations or operations requiring additional review |
| Retrying | Operations being retried and retry count |
| Duration | Time required for transfer operations |
This separates processing scale, current status, and recurring failures into different metrics for file transfers.
Dashboard Design#
Configure the dashboard by separating current status from changes over time
Instead of displaying every metric in the same way, the dashboard can use different views appropriate to the type of information.
For example, current completion and failure counts can be shown as numbers, while transfer-volume changes over time can be shown in a trend graph.
FILE TRANSFER OVERVIEW
- In Progress12
- Completed248
- Failed3
- Retrying2
- Transfer Volume Trend
- Flow StatusFlow A CompletedFlow B RunningFlow C Failed
- Retry / Failure Trend↑ Failure→ Retry↓ Recovery
For example, it can be divided as follows.
Top summary area: Current in-progress, completed, failed, and retrying status
Transfer volume area: Changes in file count and transfer size over time
Flow status area: Current execution results by operation
Failure trend area: Changes in failures over a specified period
Retry area: Recovery operations and Retry results
Dividing dashboard roles this way allows you to understand the current situation first, then review detailed status around the required metrics instead of reading every detail on one screen.
Transfer Volume Analysis#
Compare transfer volume by time and Flow to review processing patterns
Reviewing file transfer volume by time period and Flow, rather than only total volume, helps reveal actual processing patterns.
For example, you can identify patterns where backup files are concentrated in early-morning transfers or large file transfers repeatedly occur during specific business hours.
Transfer Volume
- Time RangeHour / Day
- Flow NameBackup FlowReport FlowMedia Flow
- TargetAmazon S3File ServerCloud Storage
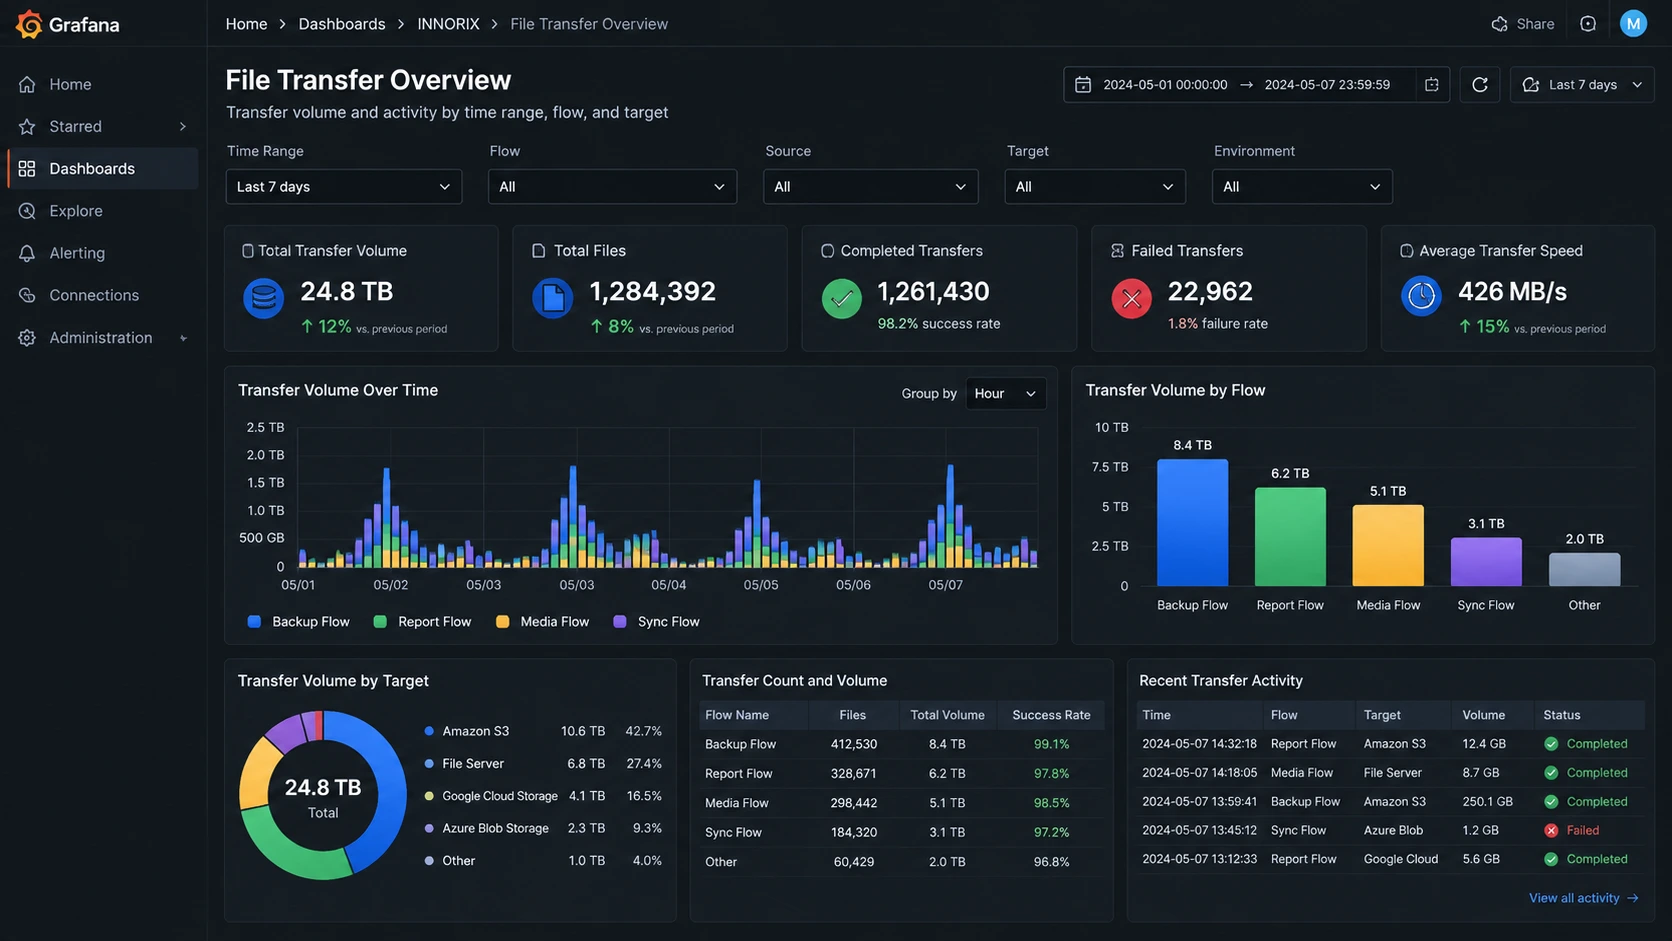
The following criteria can be used when analyzing transfer volume.
| Classification Criteria | Purpose |
|---|---|
| Time | Check whether transfers are concentrated during specific periods |
| Flow | Compare processing volume by operation |
| Source | Check transfer scale by file-generation environment |
| Target | Check stored volume by storage environment |
| File count | Check processing volume for many small files |
| Total size | Check the scale of large-file transfers |
This lets you distinguish which operations transfer large numbers of files, when, and to which environments instead of checking only total transfer volume.
Status Tracking#
Track completion, failure, and retry results over time
Even when transfer volume remains normal, failures may recur in a specific Flow.
Reviewing processing scale together with execution results shows not only how many files moved, but also whether the transfer environment is operating reliably.
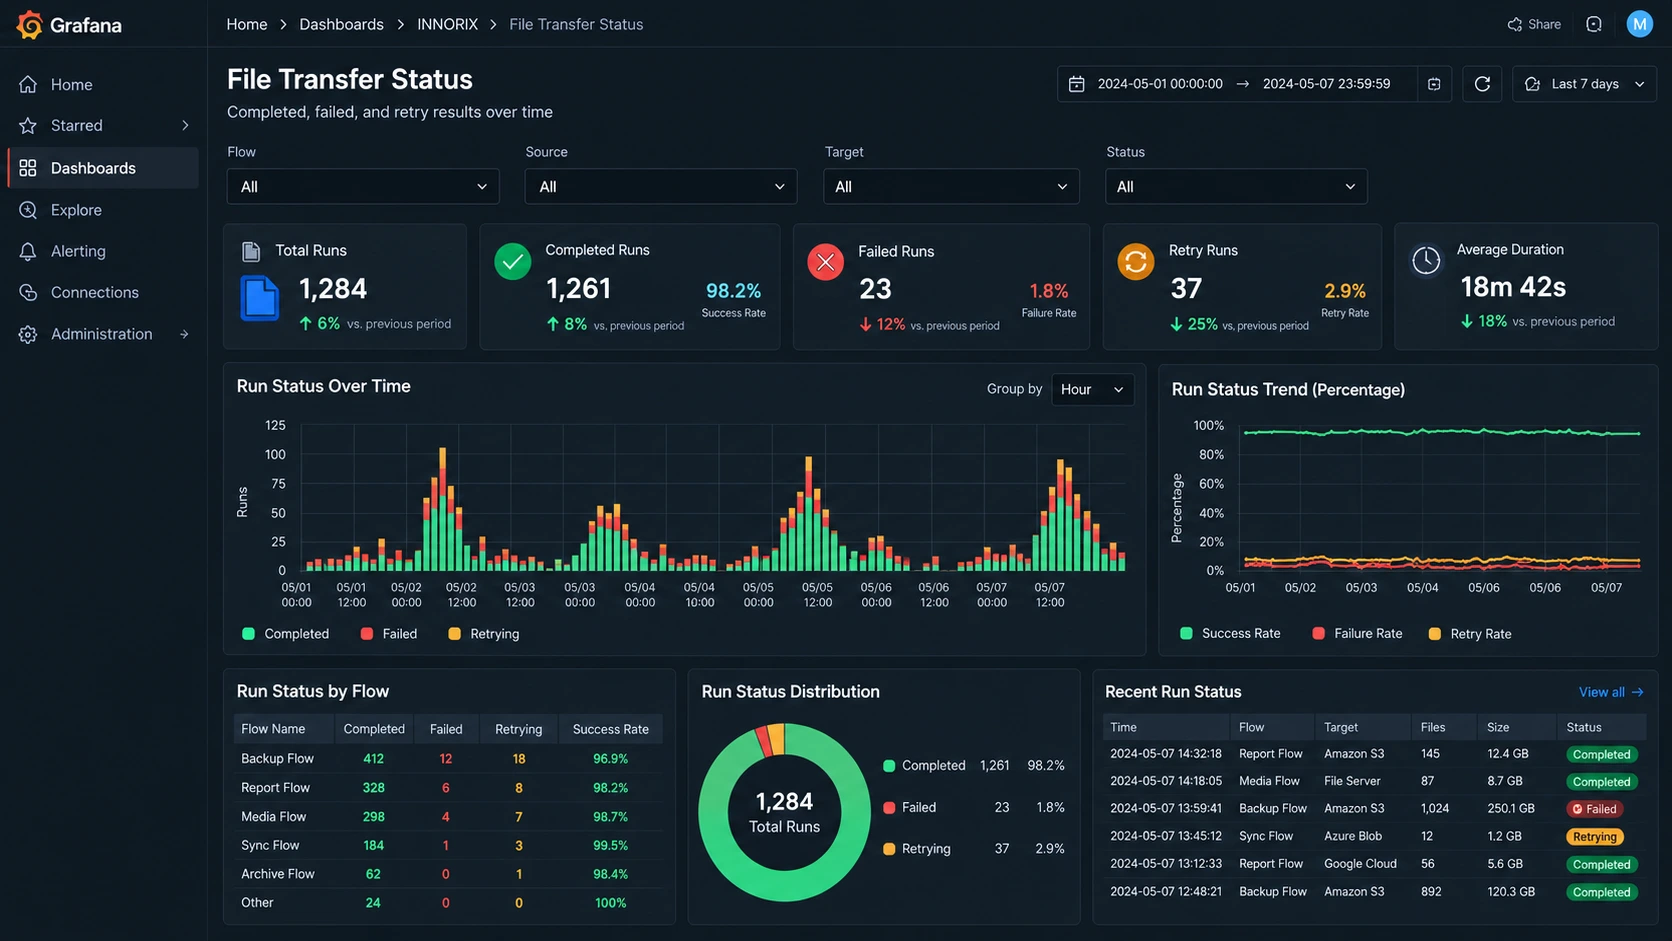
For example, if failure and retry counts increase at the same time, the network or Source, Target environments can be investigated further.
Conversely, if a retry operation transitions to Completed after a failure, you can verify whether a temporary issue occurred and recovered successfully.
This makes it possible to review the status transition from failure → retry → completion, rather than looking only at failure counts.
Flow Comparison#
Compare the status of multiple transfer operations using the same criteria
Viewing multiple Flows together in one Grafana dashboard allows the status of a specific operation to be compared with other transfer operations.
For example, if most Flows complete successfully but failures recur only for operations transferring to a specific Target, that environment can be investigated further.
Flow Status
Flow, Transfer, Current State- Backup1.2 TB, Completed
- Daily Report48 GB, Completed
- Media Upload860 GB, Retrying
- Archive2.4 TB, Failed
The following criteria can be used when comparing status by Flow.
| Criteria | Usage |
|---|---|
| Transfer volume | Compare processing scale for specific operations |
| Completion rate | Check successful processing status |
| Failure count | Check for recurring issues |
| Retry count | Check automatic recovery operations |
| Execution time | Identify operations taking longer than expected |
| Target | Check for issues in a specific storage environment |
This lets you identify which Flows require additional investigation before searching for a specific Run.
Issue Investigation#
Identify abnormal status in the dashboard and continue to Run details
If the Grafana dashboard shows an abnormal condition such as increased failures or changes in transfer volume, you can check the actual transfer results through the relevant Flow and Run details.
The issue-investigation flow can proceed as follows depending on the situation.
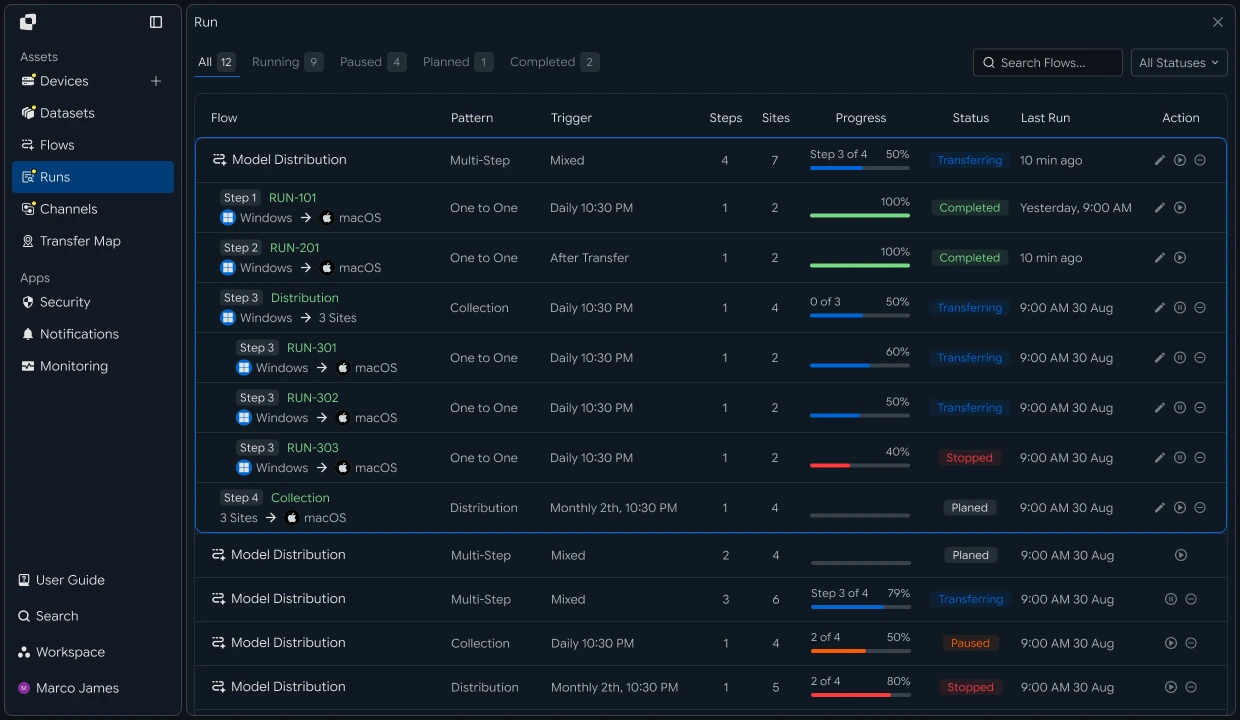
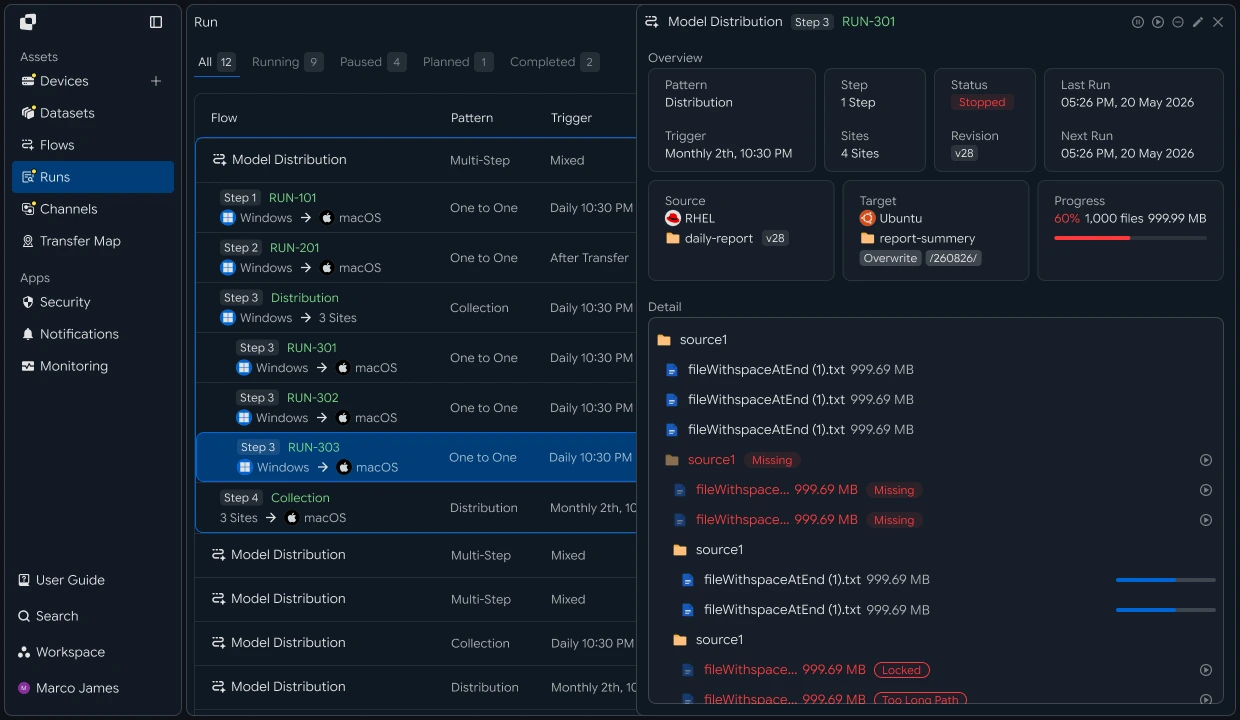
Run details show where additional investigation is required in the actual file transfer.
For example, if files cannot be read from the Source, check the file path and connection status. If storage on the Target fails, check the target storage connection and access scope.
Operations Management#
Operate by connecting overall transfer status with individual execution results
Grafana can be used to monitor the overall status and changes over time across multiple file transfer operations.
If an issue is identified, move to the relevant Flow and Run details to check the actual processing results and retry if needed.
The overall operational flow can be configured as follows.
With this recipe, you can configure a single operational flow covering execute file transfers → collect transfer volume, progress, status metrics → configure Grafana dashboard → compare status by Flow → review failure and retry trends → check Run details → reflect rerun results.
Instead of repeatedly checking individual file transfer operations, this allows you to monitor transfer volume and completion, failure, retry status comprehensively in Grafana and manage changes and issue patterns across the entire file transfer environment.
Developer#
Query and aggregate transfer history and expose metrics for Grafana
Query the transfer list and history APIs by period and status, then aggregate counts by status. Expose these metrics through a Grafana JSON-based data source. Prepare the following before starting.
| Prerequisite | Details |
|---|---|
| INNORIX authentication | INNORIX_ACCESS_TOKEN (Authorization: Bearer) |
| Query period, status | Period to aggregate (startDate, endDate) and status filter (statusFilter) |
| Grafana data source | Data source that reads HTTP JSON, such as JSON API, Infinity |
| Runtime | Python 3 + requests, Java 17+, Node.js 18+, .NET 8+ |
Python and Node.js reuse the minimal
api()helper for direct REST calls from the API Call Recipe. Java and C# use the bundledInnorixClientandJsonhelper (Jfor C#). For status codes (2=completed, 4=error, 9=partial completion, etc.), refer to the status table in the Integrity Verification, Pause and Resume Recipe.
Aggregate Transfer History by Status#
Query history by period and status, iterate through all results using the cursor, and aggregate counts by status. Return the result as JSON that Grafana can read.
def transfer_metrics(start_date, end_date, limit=200):
    counts = {}   # status -> count
    cursor = None
    while True:
        params = {"startDate": start_date, "endDate": end_date, "limit": limit}
        if cursor:
            params["cursor"] = cursor
        page = api("GET", "/api/transfer-history", params=params) or {}

        for row in (page.get("data") or []):
            status = row.get("status")
            counts[status] = counts.get(status, 0) + 1

        cursor = (page.get("pagination") or {}).get("nextCursor")
        if not cursor:
            break

    # metric shape read by the Grafana JSON datasource
    return {
        "completed": counts.get(2, 0),
        "error": counts.get(4, 0),
        "partial": counts.get(9, 0),
        "total": sum(counts.values()),
    }


metrics = transfer_metrics("2026-09-01T00:00:00Z", "2026-09-07T23:59:59Z")
print(metrics)   # e.g. {"completed": 120, "error": 3, "partial": 1, "total": 124}
static Map<String, Integer> transferMetrics(InnorixClient client, String startDate,
String endDate, int limit) {
Map<Integer, Integer> counts = new HashMap<>();
String cursor = null;
do {
Map<String, Object> params = Json.newObj("startDate", startDate, "endDate", endDate, "limit", limit);
if (cursor != null) params.put("cursor", cursor);
Map<String, Object> page = client.apiObj("GET", "/api/transfer-history", null, params);
for (Object row : Json.arrOf(page, "data")) {
Integer status = Json.intOrNull(Json.asObj(row), "status");
counts.merge(status, 1, Integer::sum);
}
Map<String, Object> pg = Json.asObj(page.get("pagination"));
cursor = pg == null ? null : Json.str(pg, "nextCursor");
} while (cursor != null);
int total = counts.values().stream().mapToInt(Integer::intValue).sum();
return Map.of(
"completed", counts.getOrDefault(2, 0),
"error", counts.getOrDefault(4, 0),
"partial", counts.getOrDefault(9, 0),
"total", total);
}async function transferMetrics(startDate, endDate, limit = 200) {
const counts = {};
let cursor = null;
do {
const params = { startDate, endDate, limit };
if (cursor) params.cursor = cursor;
const page = (await api("GET", "/api/transfer-history", null, params)) || {};
for (const row of page.data || []) counts[row.status] = (counts[row.status] || 0) + 1;
cursor = (page.pagination || {}).nextCursor;
} while (cursor);
const total = Object.values(counts).reduce((a, b) => a + b, 0);
return {
completed: counts[2] || 0,
error: counts[4] || 0,
partial: counts[9] || 0,
total,
};
}
const metrics = await transferMetrics("2026-09-01T00:00:00Z", "2026-09-07T23:59:59Z");
console.log(metrics);static async Task<Dictionary<string, int>> TransferMetricsAsync(InnorixClient client,
string startDate, string endDate, int limit = 200)
{
var counts = new Dictionary<int, int>();
string cursor = null;
do
{
var pars = new Dictionary<string, object> { ["startDate"] = startDate, ["endDate"] = endDate, ["limit"] = limit };
if (cursor != null) pars["cursor"] = cursor;
JsonObject page = await client.ApiObjAsync("GET", "/api/transfer-history", null, pars);
foreach (JsonNode row in J.ArrOf(page, "data"))
{
int? status = J.IntOrNull(row, "status");
int key = status ?? -1;
counts[key] = counts.GetValueOrDefault(key) + 1;
}
JsonObject pg = J.AsObj(page["pagination"]);
cursor = pg == null ? null : J.Str(pg, "nextCursor");
} while (cursor != null);
int total = counts.Values.Sum();
return new Dictionary<string, int>
{
["completed"] = counts.GetValueOrDefault(2),
["error"] = counts.GetValueOrDefault(4),
["partial"] = counts.GetValueOrDefault(9),
["total"] = total,
};
}Grafana connection method INNORIX does not provide a dedicated Grafana integration, so choose a method to expose the metrics above in a form Grafana can read. The simplest approach is to wrap this function in a small HTTP endpoint and query it using Grafana's JSON API, Infinity data source. Data source and panel configuration are handled in Grafana.
Cursor pagination
/api/transfer-historyadvances pages usingpagination.nextCursor. For large histories, iterate until there is no cursor and aggregate all results. If real-time progress metrics are needed, also queryGET /api/transfers(active list,statusFilter).
Implementation Result#
With this recipe, transfer metrics can be monitored in Grafana using the following flow.
Aggregate transfer history by period and status, expose it as metrics, and read it through a Grafana data source to monitor transfer counts and success and failure trends in the dashboard.