Getting Started
Basic Concept
Collect logs and diagnostic files from multiple systems into one analysis environment
Servers and applications generate logs, core dumps, error reports, and other diagnostic files during operation.
Central log and core dump collection gathers files generated by each system according to configured criteria and automatically transfers them to a designated central analysis environment.
Connecting multiple servers and applications to a single collection flow lets you review diagnostic data centrally and use it for analysis.
Server A ──┐
           │
Server B ──┼──→ Central Collection ──→ Analysis System
           │
App Server ─┤
           │
Edge Device ─┘
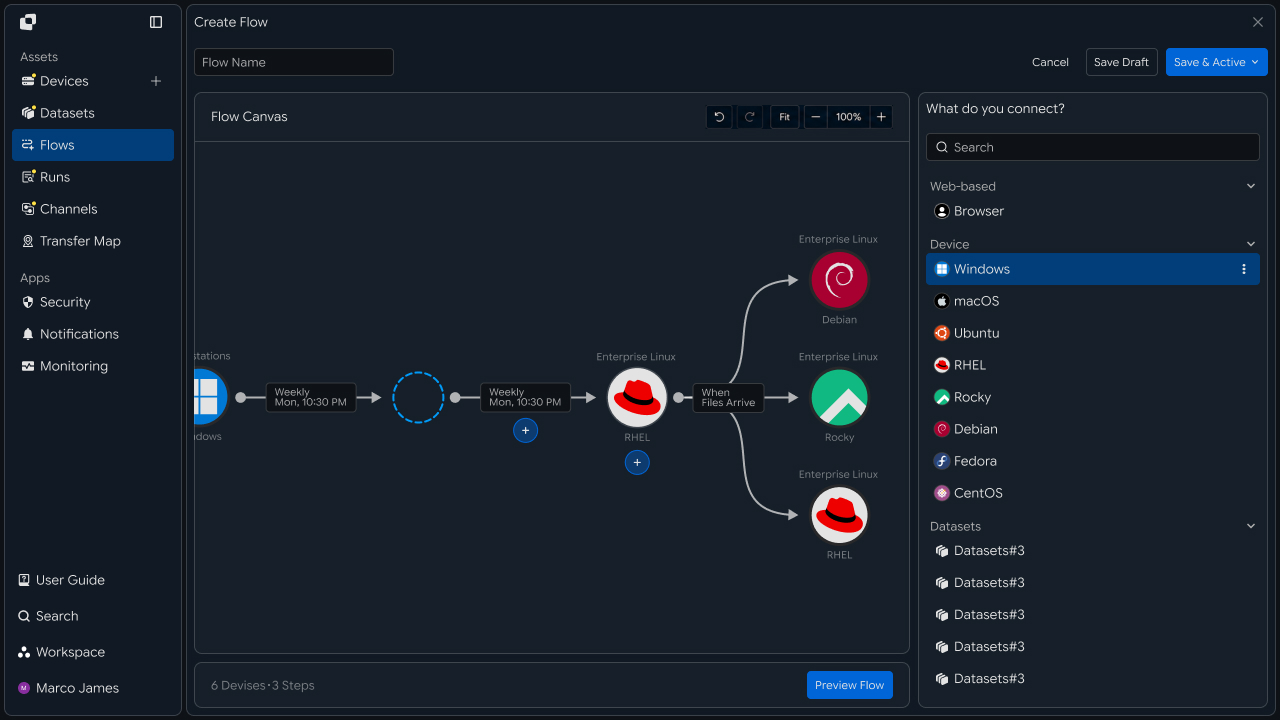
Collection Flow
Automate the flow from file creation to delivery into the central analysis environment
When a log or diagnostic file is created on a source system, collection starts based on the file type, path, and configured execution conditions.
Collected files are transferred to central storage or an analysis environment. After collection completes, the files can be passed to downstream analysis and monitoring tasks.
① Generate log or diagnostic files
↓
② Identify collection targets
↓
③ Apply collection criteria
↓
④ Transfer to the central analysis environment
↓
⑤ Connect analysis and monitoring tasks
↓
⑥ Review execution results
This creates a single operational flow for collecting diagnostic files from multiple systems and using them downstream.
Operational Benefits
Centralize distributed diagnostic data and connect it to analysis workflows
Connecting diagnostic files from multiple systems to a central collection environment lets you manage file locations, collection status, and analysis targets in one flow.
| Category | Per-System Management | Central Collection |
|---|---|---|
| File Location | Check paths on each system | Manage centrally in the collection environment |
| Collection Execution | Run tasks per system | Collect automatically based on conditions |
| Analysis Preparation | Transfer required files individually | Pass collected files to the analysis environment |
| Status Review | Check results per system | Review overall collection status |
This creates an operational flow from file creation → central collection → analysis integration → result verification.
IT Engineers
Collection Environment
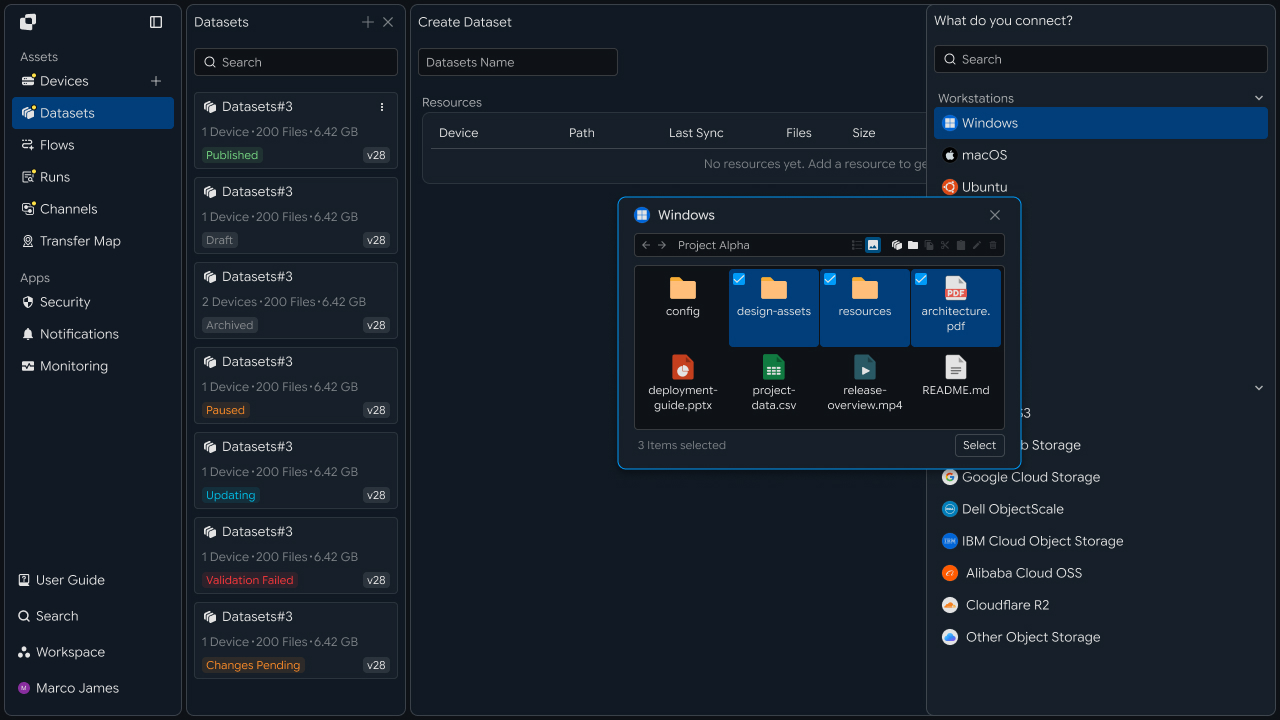
Connect systems where logs and diagnostic files are generated
First, connect the servers and application environments where logs, core dumps, and diagnostic files are generated to the collection flow.
Specify the file locations on each system to define the source paths used by the central collection job.
| Collection Environment | Typical Files |
|---|---|
| Application Server | Application logs and error reports |
| Operations Server | System logs and diagnostic files |
| Processing Server | Job logs and processing results |
| Failure Analysis Environment | Core dumps and error data |
| Edge Device | Field logs and diagnostic data |
Devices
   │
   ├── Application Server
   │       └── /var/log/application
   │
   ├── Linux Server
   │       └── /var/log/system
   │
   └── Edge Device
           └── /data/diagnostics
Collection Policy
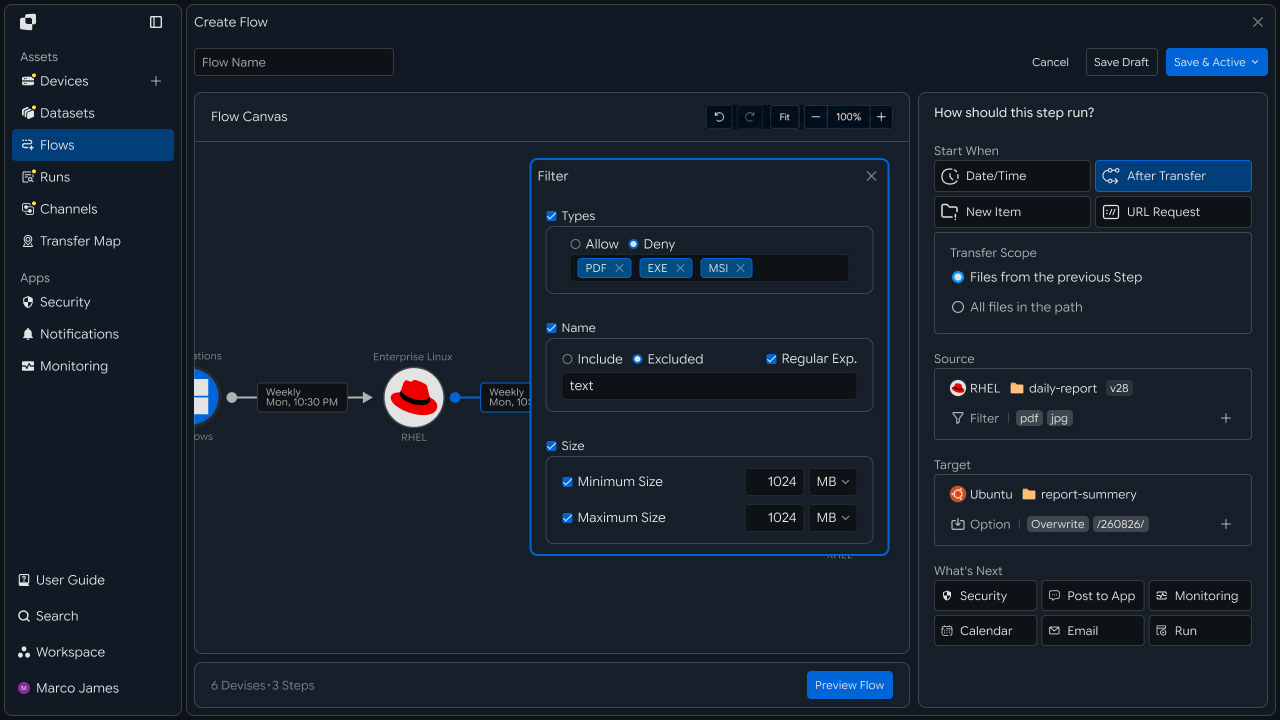
Configure collection criteria by file type and priority
After connecting the collection environment, define which files to collect and under what conditions.
Specify collection targets by file extension, path, and create or modify events, then configure processing order and execution criteria based on file type and importance.
| File Type | Collection Criteria | Processing Flow |
|---|---|---|
| Standard Log | Schedule or file change | Scheduled collection |
| Error Log | Create or modify detection | Connect to analysis workflow |
| Core Dump | File creation | Priority collection |
| Diagnostic File | Configured path and conditions | Connect to analysis and monitoring |
File Event
    │
    ▼
Collection Policy
    │
    ├── Log File ──────→ Standard Collection
    │
    ├── Error Report ──→ Analysis Flow
    │
    └── Core Dump ─────→ Priority Collection
Central Collection
Transfer diagnostic files from multiple systems to a central analysis environment
Transfer files from each system to a central storage location according to the configured collection criteria.
Bring files from multiple systems into one central environment, then connect downstream tasks based on file type or analysis purpose.
Application ───┐
               │
Database ──────┼──→ Central Storage
               │           │
Server ────────┤           ├──→ Analysis
               │           │
Edge ──────────┘           └──→ Monitoring
Analysis Integration
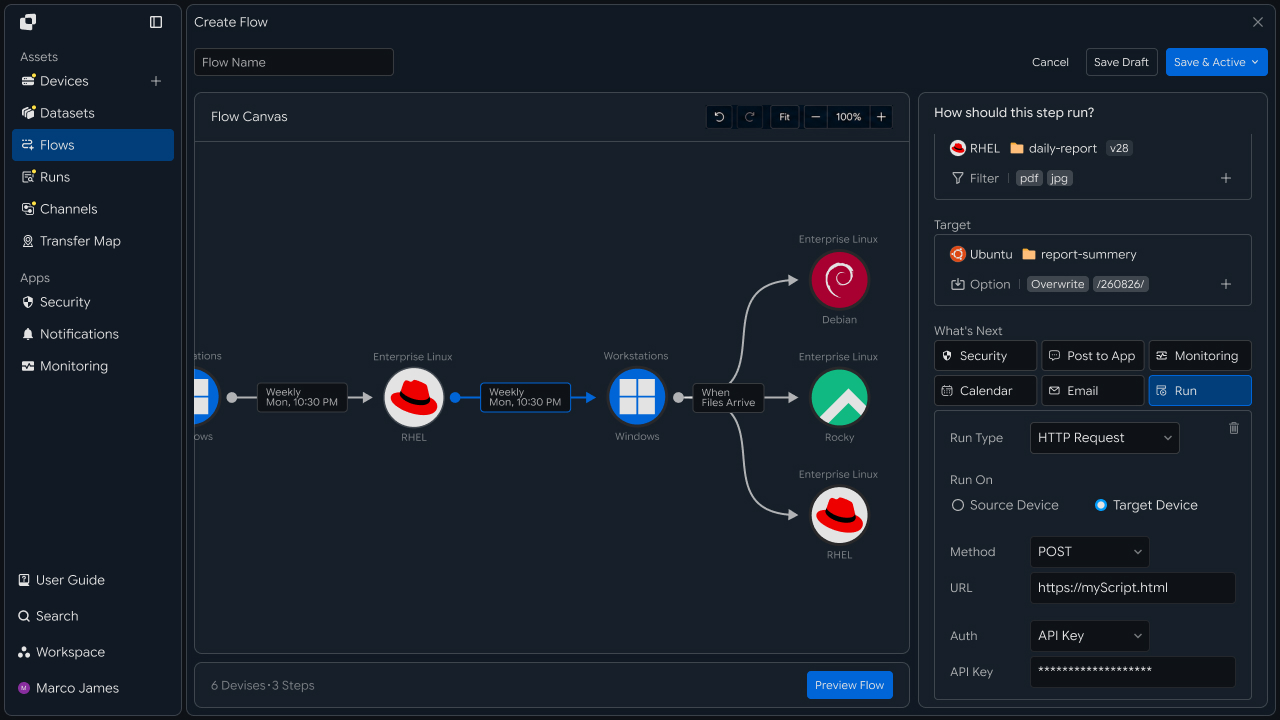
Connect collected files to downstream analysis and monitoring tasks
After files are collected centrally, completed files can be used immediately by analysis systems or monitoring environments.
Using collection completion as the execution condition for the next task lets you extend the workflow from file transfer into analysis.
Collection Completed
        │
        ▼
   File Available
        │
   ┌────┴─────┐
   ▼          ▼
Analysis   Monitoring
   │          │
   └────┬─────┘
        ▼
   Result Tracking
Operational Review
Review collection status and execution results, then rerun required tasks
When collection runs, use Runs and detailed execution history to review per-system file processing status and results.
Review the collection environment, file paths, connection state, and processing results together. For jobs that require additional review, take the necessary action based on the details and rerun the required operation.
Collection Run
      │
      ▼
Status Check
      │
      ├── Completed ─────→ Result Check
      │
      └── Review Required
               │
               ▼
          View Details
               │
               ▼
   Source / Path / Connection Check
               │
               ▼
          Run Again
               │
               ▼
          Result Check
| Item | Details |
|---|---|
| Collection System | Server or device where the file was generated |
| Collection Target | Log, core dump, or diagnostic file |
| Execution Status | Current job status and progress |
| Processing Result | Number and total size of collected files |
| Target Environment | Central storage and analysis location |
| Execution History | Results of collection and downstream tasks |
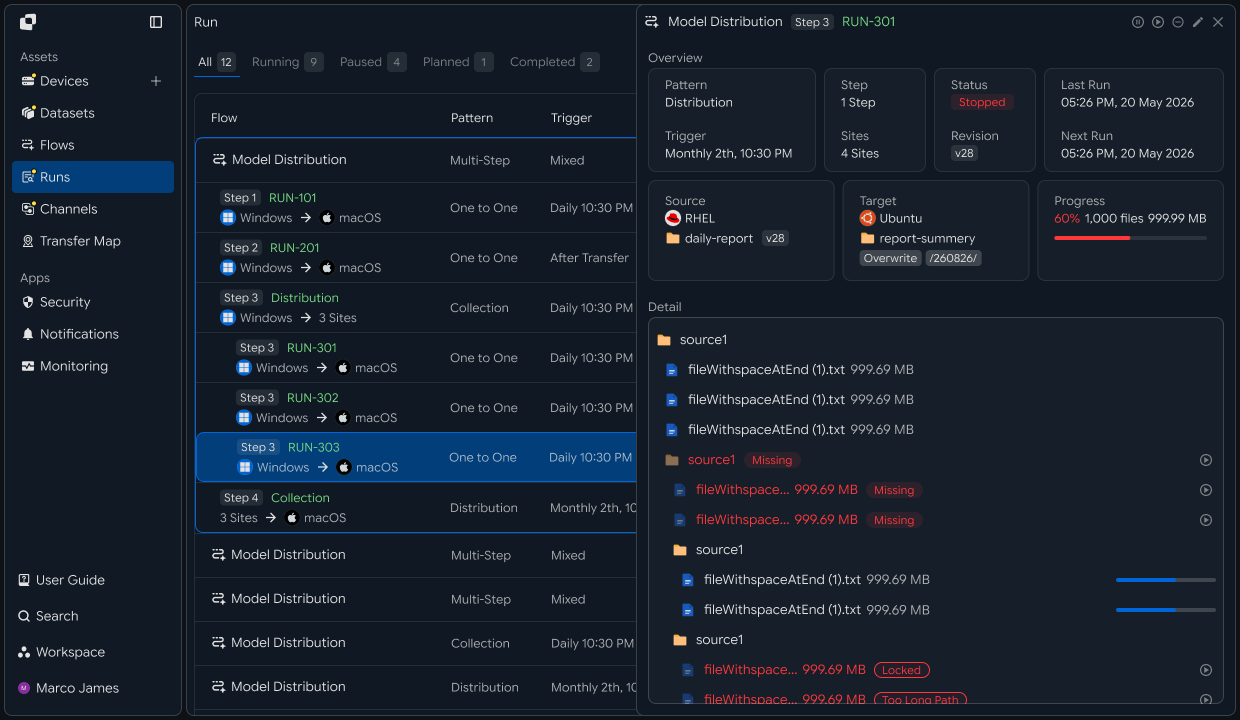
Developers
Filter logs and core dumps by type and collect them on a central host
Integration Setup
Prepare shared API calls and path encoding
import os
import requests

BASE_URL = os.getenv("INNORIX_BASE_URL", "https://app.innorix.com").rstrip("/")
TOKEN = os.environ["INNORIX_ACCESS_TOKEN"]
WORKSPACE_ID = os.getenv("INNORIX_WORKSPACE_ID")   # optional; falls back to the current workspace

STATUS_COMPLETE = 2
TERMINAL = {2, 4, 5, 9, 99}          # complete / error / cancelled / partial / failed
NOT_SUCCEEDED = {4, 5, 9, 99}


def api(method, path, body=None, params=None):
    headers = {
        "Content-Type": "application/json",
        "Authorization": f"Bearer {TOKEN}",
    }

    if WORKSPACE_ID:
        headers["x-workspace-id"] = WORKSPACE_ID

    response = requests.request(
        method, BASE_URL + path,
        headers=headers, json=body, params=params, timeout=30,
    )

    payload = response.json() if response.content else {}

    if not response.ok:
        raise RuntimeError(payload.get("message") or f"HTTP {response.status_code}")

    return payload.get("data")


def is_terminal(detail):
return detail.get("isTerminal", detail.get("status") in TERMINAL)import base64
import time
def encode_path(device_id, raw_path):
normalized = str(raw_path or "").replace("\\", "/")
token = base64.b64encode(normalized.encode("utf-8")).decode("ascii")
return f"{device_id}_ino_{token}"
def now_iso():
return time.strftime("%Y-%m-%dT%H:%M:%S.000Z", time.gmtime())Use the following values to determine transfer status. There are five terminal states, and Complete (2) is the successful state.
| Status Value | Meaning | Terminal |
|---|---|---|
| 2 | Complete | Yes |
| 4 | Error | Yes |
| 5 | Cancelled | Yes |
| 9 | Partial Complete | Yes |
| 99 | Failed | Yes |
| 1 · 6 · 12 · 13 | Starting · Transferring · Synchronizing · Receiving | No |
Select Collection Targets
Select only the files to collect by extension and size
Log folders often contain files that do not need to be collected. Define filters so only required files are transferred.
def build_filter(exts=None, min_size=None, exclude=None):
    file_option = {}

    if exts:
        # extension whitelist, without the leading dot
        file_option["extension"] = {
            "extension": [e.lstrip(".").lower() for e in exts],
            "allow": True,
        }

    if min_size is not None:
        # over and equal both True means size or larger
        file_option["fileSize"] = {"size": min_size, "over": True, "equal": True}

    if exclude:
        # allow=False excludes files whose name contains this. Server matching is case sensitive.
        file_option["fileName"] = {"name": exclude, "allow": False}

    return {"send-fileoption": file_option} if file_option else {}
Use send-fileoption.extension for extension filters. The send-filetype-cus regular expression matches only the file name without its extension, so it does not work as an extension filter.
| Filter | Location | Behavior |
|---|---|---|
| Extension | send-fileoption.extension | With allow: true, transfer only files with these extensions |
| Size | send-fileoption.fileSize | Use over and equal to define inclusive size thresholds |
| Name | send-fileoption.fileName | With allow: false, exclude files containing the specified text |
When multiple filters are provided, they are combined with AND. Only files that match every condition are transferred.
LOG_FILTER = build_filter(exts=["log", "gz"], exclude=".lck")
DUMP_FILTER = build_filter(exts=["core", "dmp", "hprof"])
Logs are often rotated and compressed as .gz files, so include both the original and compressed extensions. Use a name condition to exclude lock files.
Use search to verify that the filters match the intended files before enabling collection.
page = api("POST", f"/api/devices/{device_id}/files/search",
           {"path": "/var/log/application", "pageSize": 500})

matched = [i for i in page["items"]
           if i["type"] == "file" and i["name"].endswith((".log", ".gz"))]

print(f"{len(matched)} matched")
Register Scheduled Collection
Collect standard logs at a specified time
def build_collection(name, source, source_path, target, target_path,
                     schedule, options):
    return {
        "name": name,
        "flowName": name,
        "transferType": "normal",
        "timezone": "Asia/Seoul",
        "step": 1,
        "isUpcoming": False,
        "details": [
            {
                "senderId": source,
                "receiverId": target,
                "sourceItem": [
                    {
                        "hash": encode_path(source, source_path),
                        "filePath": source_path,
                        "isDir": True,
                    }
                ],
                "targetPath": encode_path(target, target_path),
                "step": 1,
                "transferOptions": {
                    "noSchedule": False,
                    "target-action": "numbering",
                    "send-fileoption": {},
                    **options,
                },
            }
        ],
        "schedules": [schedule],
    }


DAILY_4AM = {
    "type": "day",
    "startDateType": "now",
    "hour": "04",
    "minute": "00",
    "ampm": "am",
    "startDate": now_iso(),
    "timezone": "Asia/Seoul",
}

api("POST", "/api/automations", build_collection(
    "daily log", "device-app-01", "/var/log/application",
    "device-central-01", "/collect/device-app-01",
    DAILY_4AM, LOG_FILTER))
There are four required considerations when creating the automation request.
| Item | Configuration |
|---|---|
isUpcoming | Must be false. The server default of true ignores the schedule in the request and replaces it with a one-time five-minute schedule. Steps with triggerAutomation are forced to false by the server, so you only need to set it explicitly on the first step when no trigger is present. |
step | Include it at both the top level and in details. It identifies the hop position within the flow. |
sourceItem | Include both hash (path token) and filePath (plain-text path). |
syncType | Include it inside transferOptions. 1 is one-way and 2 is two-way. |
Registration succeeds even if all four fields are omitted, but runtime behavior changes. If a recurring schedule runs only once, check isUpcoming first.
Use numbering for diagnostic files so each collection cycle is preserved. With overwrite, rotating logs with the same name would replace one another.
Register Immediate Collection
Collect a core dump as soon as it is created
Core dumps are most useful immediately after a failure, so collect them as soon as they are created. Register a real-time monitoring automation with transferType set to sync and include syncType and watchFolderType in transferOptions.
body = build_collection(
    "core dump", "device-app-01", "/var/crash",
    "device-central-01", "/collect/device-app-01/dump",
    {"type": "none", "startDateType": "now",
     "startDate": now_iso(), "timezone": "Asia/Seoul"},
    {**DUMP_FILTER, "syncType": 1, "watchFolderType": 1})

body["transferType"] = "sync"
body["details"][0]["transferOptions"]["noSchedule"] = True

api("POST", "/api/automations", body)
Place syncType and watchFolderType inside transferOptions. The monitored path is read from sourceItem[0].filePath, so the plain-text path inserted by build_collection becomes the monitored location.
The agent treats the file as fully written once its size stops changing, then emits the event. Large files such as core dumps may take longer to trigger, which prevents partially written files from being transferred.
Register Multiple Systems
Store source servers in a list and register them in bulk
When you have dozens of servers, creating each collection job manually is impractical. Store them in a list and iterate over it.
SOURCES = [
    ("device-app-01", "/var/log/application"),
    ("device-app-02", "/var/log/application"),
    ("device-linux-01", "/var/log/system"),
    ("device-edge-01", "/data/diagnostics"),
]

for source, path in SOURCES:
    api("POST", "/api/automations", build_collection(
        f"collect {source}", source, path,
        "device-central-01", f"/collect/{source}",
        DAILY_4AM, LOG_FILTER))
Include the device identifier in the destination path. Servers may generate files with the same name, such as application.log, so storing everything in one path would make the source impossible to distinguish.
/collect/
    device-app-01/
        application.log
    device-app-02/
        application.log
Analysis Integration
Call an analysis job after collection completes
body["processors"] = [{
    "category": "run",
    "type": "http",
    "config": {
        "url": "https://internal.example.com/analyze",
        "method": "POST",
    },
}]
Specify category and type, and place url, method, and body inside config.
The callback is sent after the transfer completes. Process the receiving endpoint as follows.
def on_collect_hook(payload):
    monitor_id = payload.get("monitorId")

    # If you subscribed to the completed event only, this check can be skipped
    if monitor_id:
        detail = api("GET", f"/api/transfers/{monitor_id}")

        if detail["status"] != STATUS_COMPLETE:
            return skip_failed_collection(payload)

    start_analysis(payload)
Review Collection Status
Review collection counts and failures by system
def wait(monitor_id, timeout=3600, interval=3):
    deadline = time.time() + timeout

    while time.time() < deadline:
        detail = api("GET", f"/api/transfers/{monitor_id}")

        if is_terminal(detail):
            return detail

        time.sleep(interval)

    raise TimeoutError(monitor_id)


def failed_files(monitor_id):
    result = api("GET", f"/api/transfers/{monitor_id}/files", params={
        "state": "any", "size": 500,
    }) or {}

    return [r for r in (result.get("children") or [])
            if r.get("status") in NOT_SUCCEEDED]


def retry_failed(monitor_id):
    rows = failed_files(monitor_id)

    if not rows:
        return 0

    api("POST", f"/api/transfers/{monitor_id}/retry", {
        "filesRetry": [
            {"filePath": r["sourceFilePath"], "isDir": bool(r.get("isFolder"))}
            for r in rows
        ]
    })

return len(rows)from collections import Counter
from datetime import datetime, timedelta, timezone
def history(device_id, days=1):
end = datetime.now(timezone.utc)
fmt = "%Y-%m-%dT%H:%M:%SZ"
return list(paginate(f"/api/devices/{device_id}/transfer-history", params={
"startDate": (end - timedelta(days=days)).strftime(fmt),
"endDate": end.strftime(fmt),
}))
for source, _ in SOURCES:
rows = history(source)
failed = [r for r in rows if r.get("status") in NOT_SUCCEEDED]
mark = "" if not failed else " <- needs attention"
print(f"{source:20} collected {len(rows):>4} failed {len(failed):>3}{mark}")Diagnostic-file collection is most valuable during an incident, but collection itself may also fail at that moment. Monitor collection failures separately.
| Item | Details |
|---|---|
| Collection Target | Extension and file-name filters |
| Collection Method | Scheduled run or create-event detection |
| Destination Path | Storage location separated by device |
| Analysis Integration | Task called after collection |
| Collection Failure | Failure count and retry by system |