Overview
You can configure Prometheus integration to send and monitor file transfer tasks and device status changes.
Prometheus basically collects targets using a Pull method, but this integration sends data using a Push method to the Prometheus Remote Write Receiver.
After completing the integration, data is sent to Prometheus whenever designated events occur, such as a transfer being Started (Transfer Started) or Completed (Transfer Completed), or a device being Connected (Device Connected) or Disconnected (Device Disconnected).
The entire process consists of two steps: ① Prepare the Prometheus Remote Write Receiver → ② Configure the integration in the product.
Prerequisites
Before you begin, check the following.
| Item | Description |
|---|---|
| Prometheus server | A Prometheus server and administrator permissions to enable the Remote Write Receiver are required. |
| Prometheus Endpoint | Check the Prometheus Endpoint that will receive data (default port 9090). |
| Network | Network access to the Prometheus Endpoint (default 9090) must be available from the environment where the product is installed. |
Prepare the Prometheus Remote Write Receiver
To send data from the product to Prometheus, enable the Remote Write Receiver and check the Endpoint and authentication information.
Step 1. Enable the Remote Write Receiver
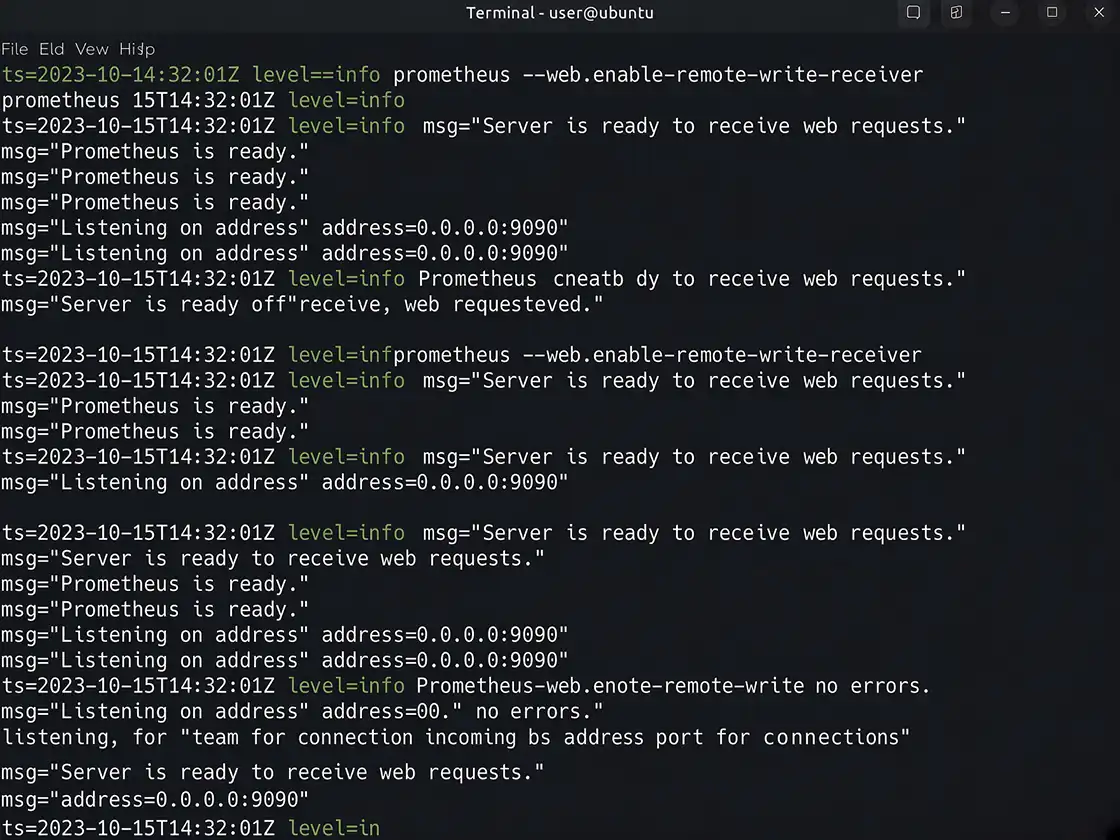
Run Prometheus with the --web.enable-remote-write-receiver option.
The receiving path of the Remote Write Receiver is as follows.
/api/v1/write
ℹ️ If this feature is not enabled, the remote write receiver needs to be enabled message is displayed with a
404 Not Founderror when data is sent.
Step 2. Check the Endpoint and Authentication Information
Check the Prometheus Endpoint.
Example:
http://localhost:9090
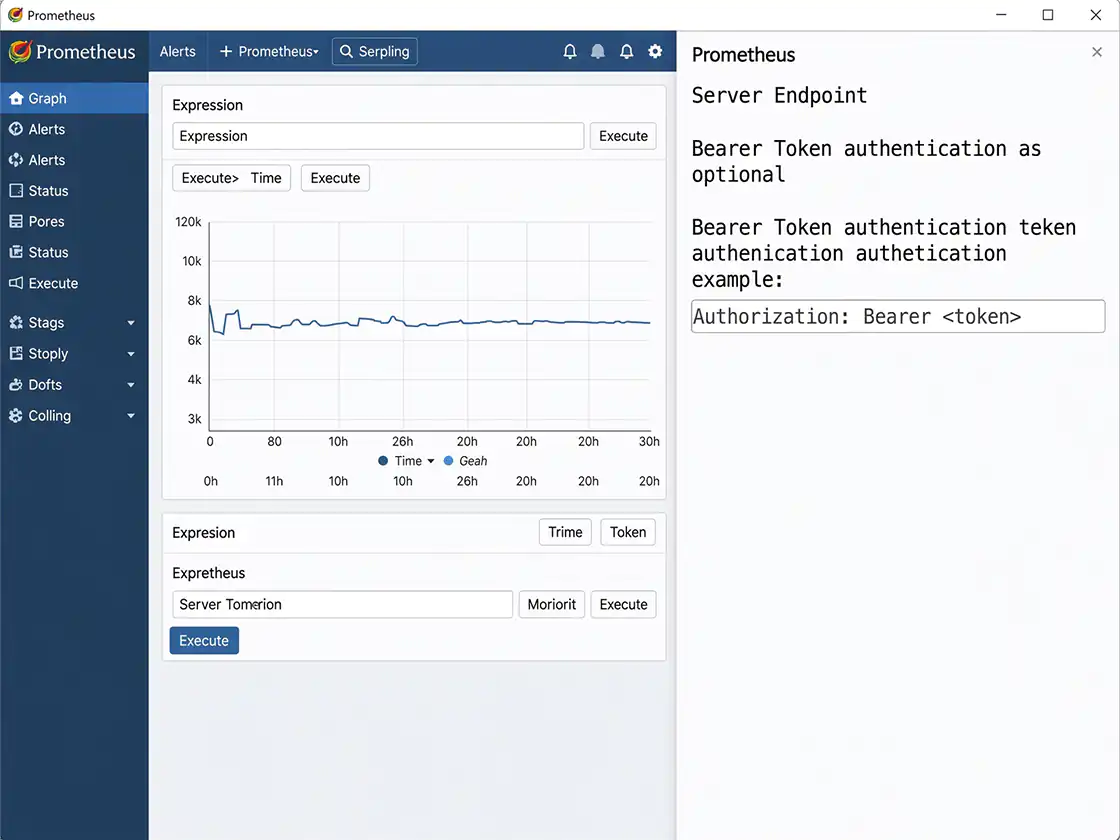
If authentication is required, configure Bearer Token authentication in a reverse proxy (such as nginx) or the Prometheus web configuration and prepare the Token.
If it is used without authentication on an internal network, you do not need to enter an Auth Token.
ℹ️ An Auth Token has the same level of access as a password, so make sure it is not exposed in public repositories or external documents.
Checklist
- ✔ The Remote Write Receiver has been enabled.
- ✔ The Prometheus Endpoint has been confirmed.
- ✔ An Auth Token has been prepared if required.
Configure Prometheus Integration
Enter the confirmed Endpoint and authentication information in the product.
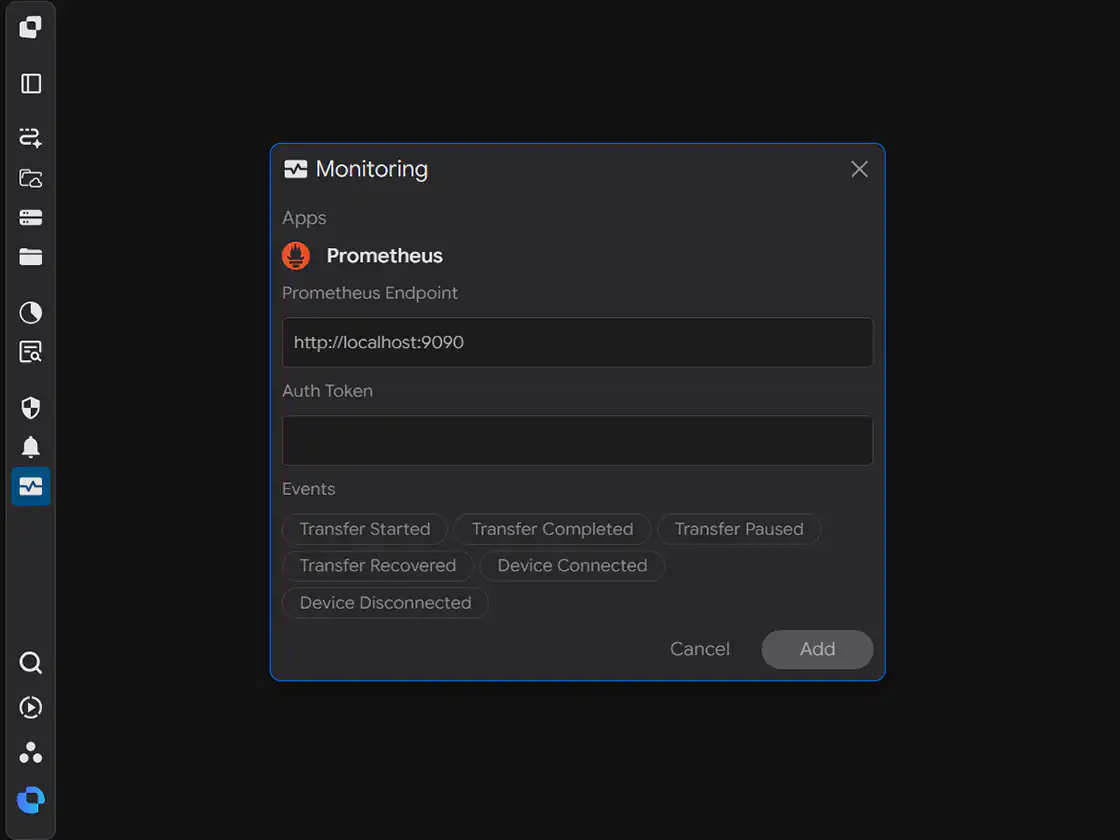
When you open the Monitoring settings window, the following screen is displayed.
Step 1. Enter the Prometheus Endpoint
Enter the Endpoint in the Prometheus Endpoint field.
Example:
http://localhost:9090
Step 2. Enter the Auth Token
If authentication is used, enter the Auth Token.
Leave it empty if authentication is not used.
Step 3. Select Events
Select the events to monitor under Events.
You can select multiple events, and data is sent to Prometheus only when the selected events occur.
| Event | When It Occurs |
|---|---|
| Transfer Started | When the transfer task starts |
| Transfer Completed | When the transfer task is completed successfully |
| Transfer Paused | When the transfer task is temporarily paused |
| Transfer Recovered | When the transfer is automatically recovered and resumed after an interruption or error |
| Device Connected | When a device is connected |
| Device Disconnected | When a device is disconnected |
Step 4. Save the Settings
After completing the input, click Add to save the integration.
Checklist
- ✔ The Prometheus Endpoint has been entered.
- ✔ An Auth Token has been entered if required.
- ✔ The events to monitor have been selected.
Verify the Integration
Verify that the settings are working correctly.
Step 1. Trigger a Test Event
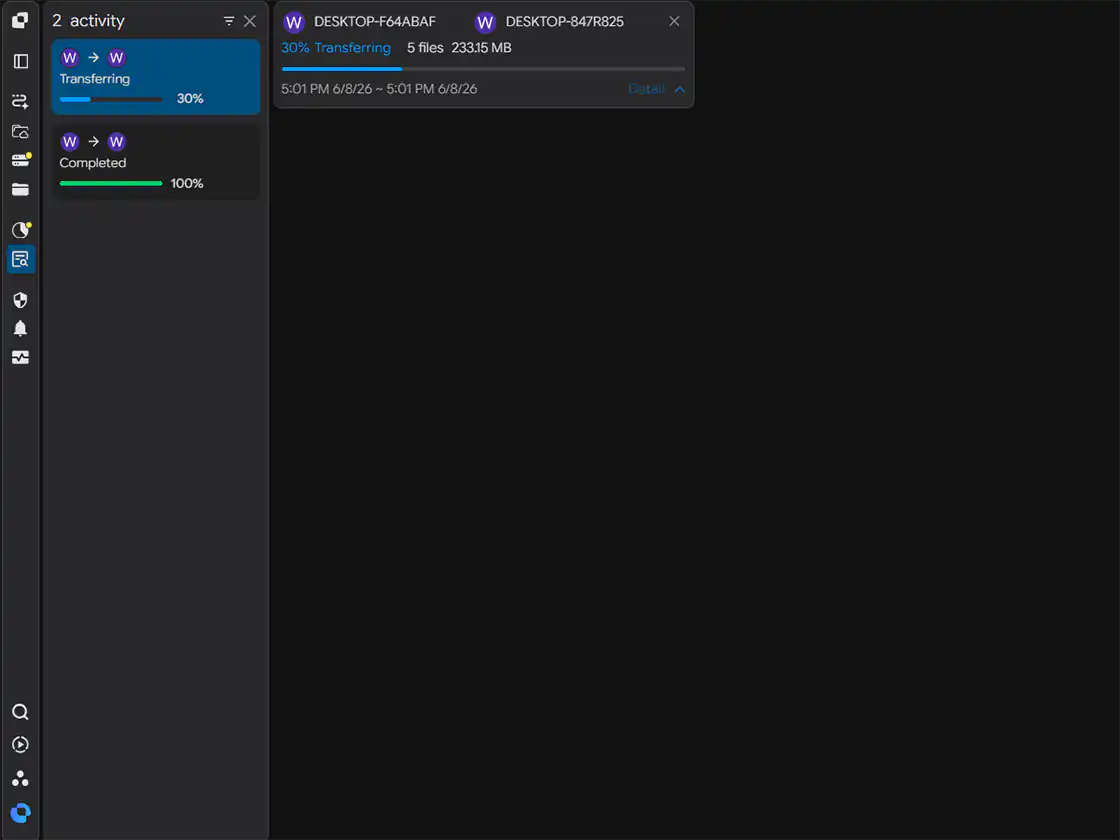
Run an actual transfer task or trigger one of the selected events.
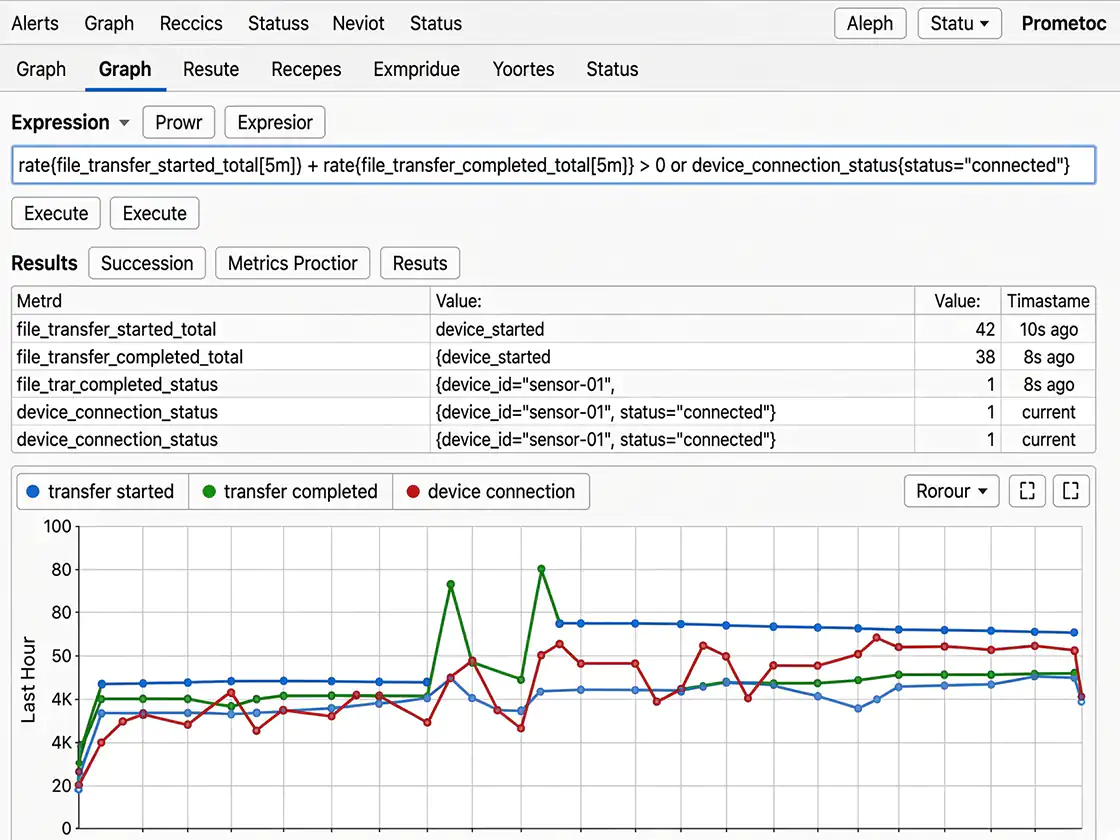
Step 2. Check Prometheus
Check whether the transferred metrics have been collected successfully in the Prometheus UI.
Checklist
- ✔ Metrics have been collected in Prometheus.
- ✔ The triggered event was delivered successfully.
Setup Complete
Once the settings are saved, the integration is applied.
After that, data is automatically sent to Prometheus whenever the selected events occur.
Troubleshooting
| Issue | Checklist |
|---|---|
| Data is not collected | Check whether the Prometheus Endpoint and Auth Token are correct and whether there are leading or trailing spaces or missing characters. |
A 404 Not Found error occurs | Check whether Prometheus is running with the --web.enable-remote-write-receiver option. |
| A 401/403 authentication error occurs | Check whether the Auth Token is correct and matches the reverse proxy or authentication configuration. |
| Connection fails | Check whether the Prometheus Endpoint and port (default 9090) are correct and whether access is allowed by the firewall or network policy. |