Getting Started
Core Concepts
Connect file transfer information to your monitoring environment
When a file transfer task runs, it generates various operational details, including task status, processed file count and size, execution time, and transfer performance.
The Datadog · Grafana integration collects this information in the monitoring environment so file transfer tasks can be managed together with overall system operations.
File Transfer
      │
      │ Status · Metrics · Events
      ▼
Monitoring Environment
      │
 ┌────┴────┐
 ▼         ▼
Datadog  Grafana
      │
      ▼
 Operations
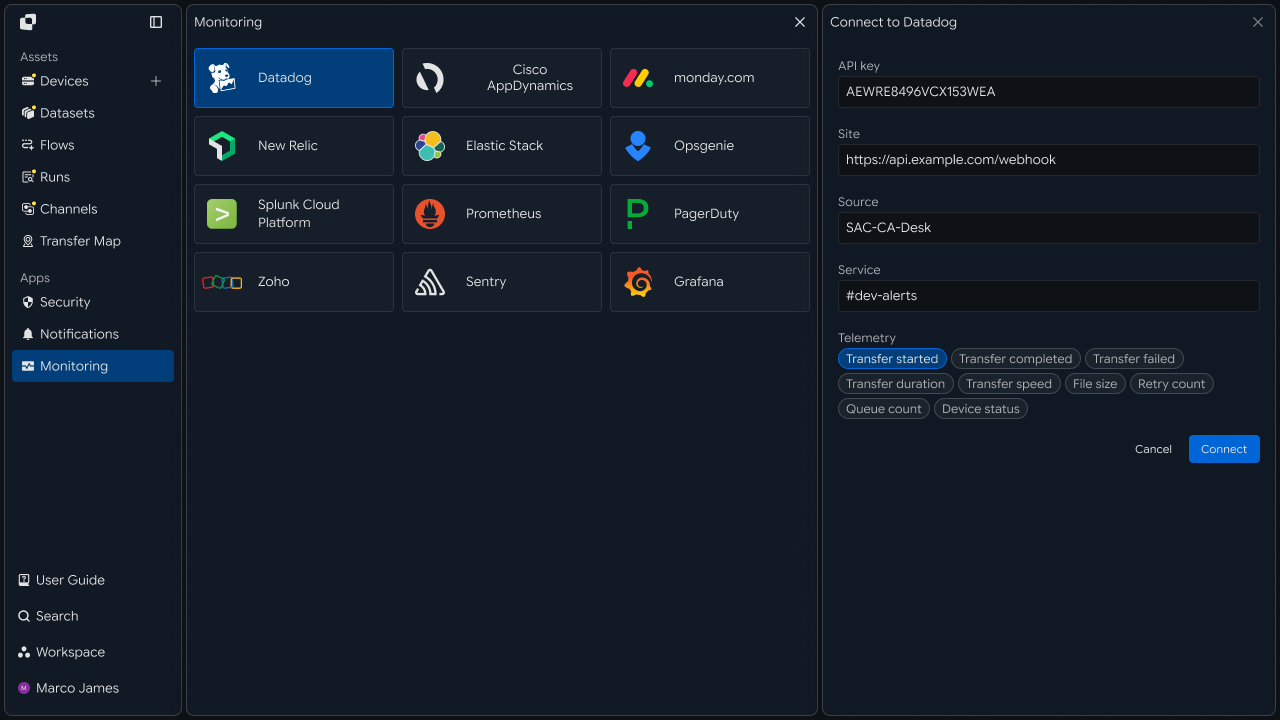
Connecting the file transfer environment to a monitoring system lets you review individual file task results and overall operational status using the same criteria.
Monitoring Flow
Connect everything from transfer execution to information collection and operational review
When a file transfer runs, status and performance information is generated during processing. This information is collected in the monitoring environment and used for operational review through dashboards and event criteria.
Run File Transfer
      │
      ▼
Generate Status · Performance Information
      │
      ▼
Collect Monitoring Information
      │
 ┌────┴───────┐
 ▼            ▼
Dashboard      Event Detection
 ▼            ▼
Operational Review     Operations Alert
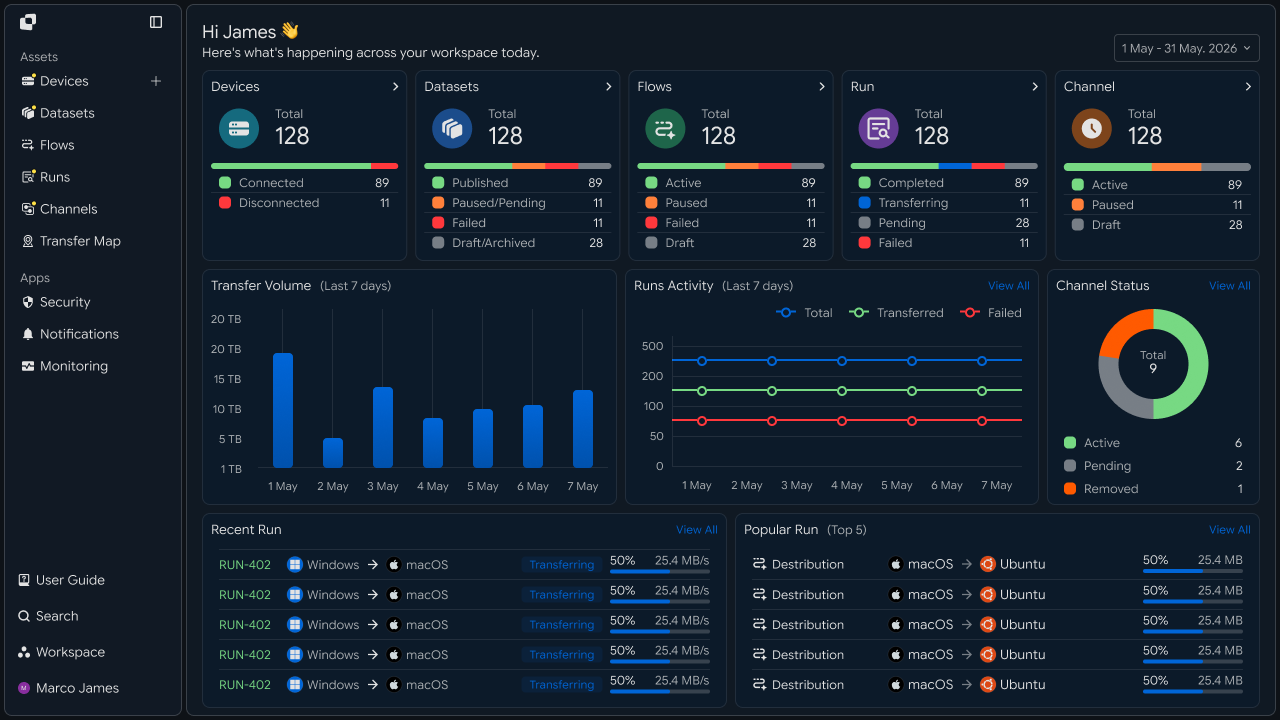
This flow lets you check the current file transfer status and key operational events in your existing monitoring environment.
Operational Changes
Manage file transfer information alongside existing operations views
When connected to Datadog · Grafana, file transfer information is managed alongside information from other systems in the existing operations environment.
| Category | File Transfer-Focused Review | Integrated Monitoring Environment |
|---|---|---|
| Status | Review execution results by task | Review status in the overall operations view |
| Performance | Review based on individual execution results | Review performance changes by time and device |
| Events | Review status by task | Detect events according to operational criteria |
| Analysis | Focus on individual tasks | Analyze operations using accumulated data |
Connecting file transfer information to the existing monitoring environment creates a single flow from current status checks through long-term operational analysis.
IT Engineers
Integrate file transfer information into the existing monitoring environment
Monitoring Connection
Connect the file transfer environment to monitoring tools
First, configure the integration environment so file transfer information generated by Innorix can be used in Datadog or Grafana.
Configure the connection information between file transfer devices and the monitoring system, then specify the information to collect and its scope.
┌────────────────┐
│ File Transfer  │
│ Environment    │
└────────┬───────┘
         │
         ▼
┌────────────────┐
│ Monitoring     │
│ Integration    │
└────────┬───────┘
         │
    ┌────┴────┐
    ▼         ▼
 Datadog    Grafana
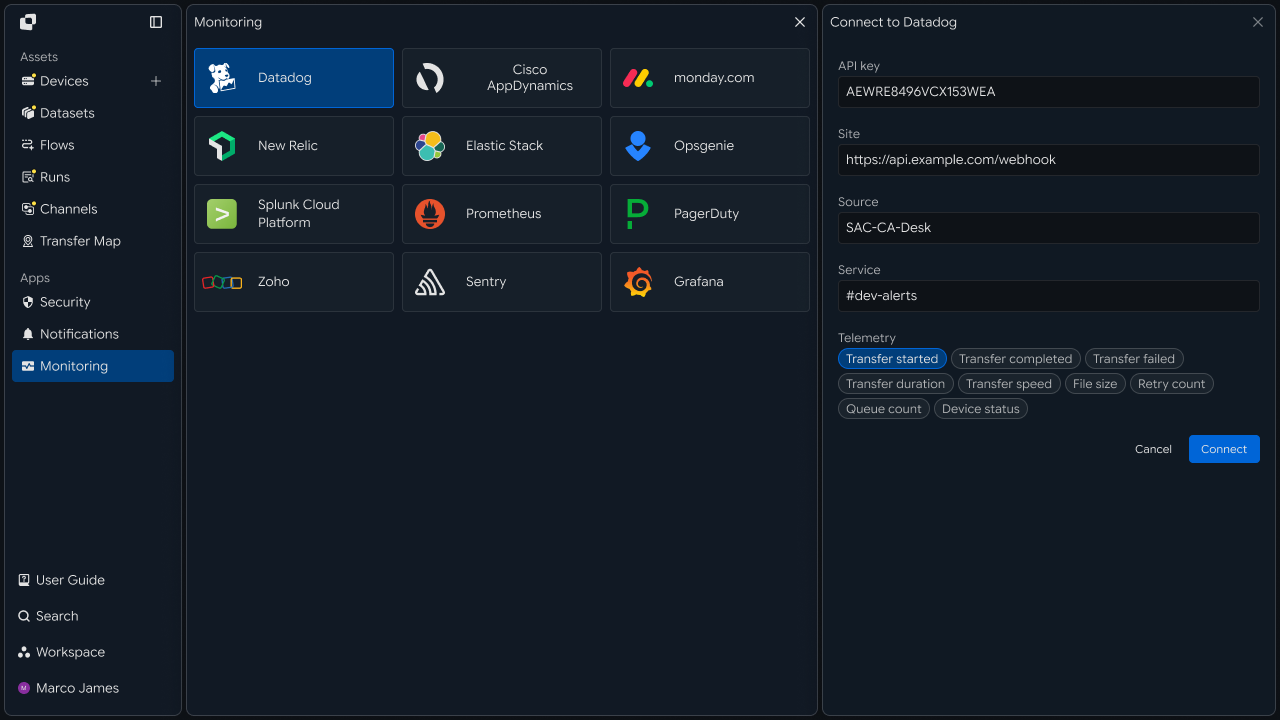
Once the integration environment is ready, operational information generated by file transfer tasks can be collected by the designated monitoring system.
Information Collection
Collect transfer status and performance information
After integration is complete, configure the file transfer information required for operations as collection targets.
Connect the required data to the monitoring environment based on execution status, file processing information, processing time, and transfer performance.
File Transfer Run
        │
        ├── Status
        │
        ├── Files
        │
        ├── Duration
        │
        ├── Transfer Rate
        │
        └── Events
               │
               ▼
        Monitoring Data
| Category | Key Information Collected |
|---|---|
| Execution | Task status and execution result |
| Files | Processed file count and size |
| Time | Start time and processing duration |
| Performance | Transfer speed and throughput |
| Events | Start, completion, and status changes |
| Device | System that executed the task |
Collected information can be used as the basis for dashboards, event detection, and operational analysis.
Dashboard
Review key file transfer information in the operations view
Configure collected file transfer information in Datadog or Grafana dashboards.
Depending on the operational purpose, you can display currently running tasks, recent processing results, device-level throughput, and performance changes in a single view.
┌──────────────────────────────────────┐
│         Operations Dashboard         │
├──────────────┬────────────┬──────────┤
│ Running      │ Completed  │ Transfer │
│ Transfers    │ Transfers  │ Volume   │
├──────────────┼────────────┼──────────┤
│ Device       │ Duration   │ Rate     │
│ Status       │ Trend      │ Trend    │
└──────────────┴────────────┴──────────┘
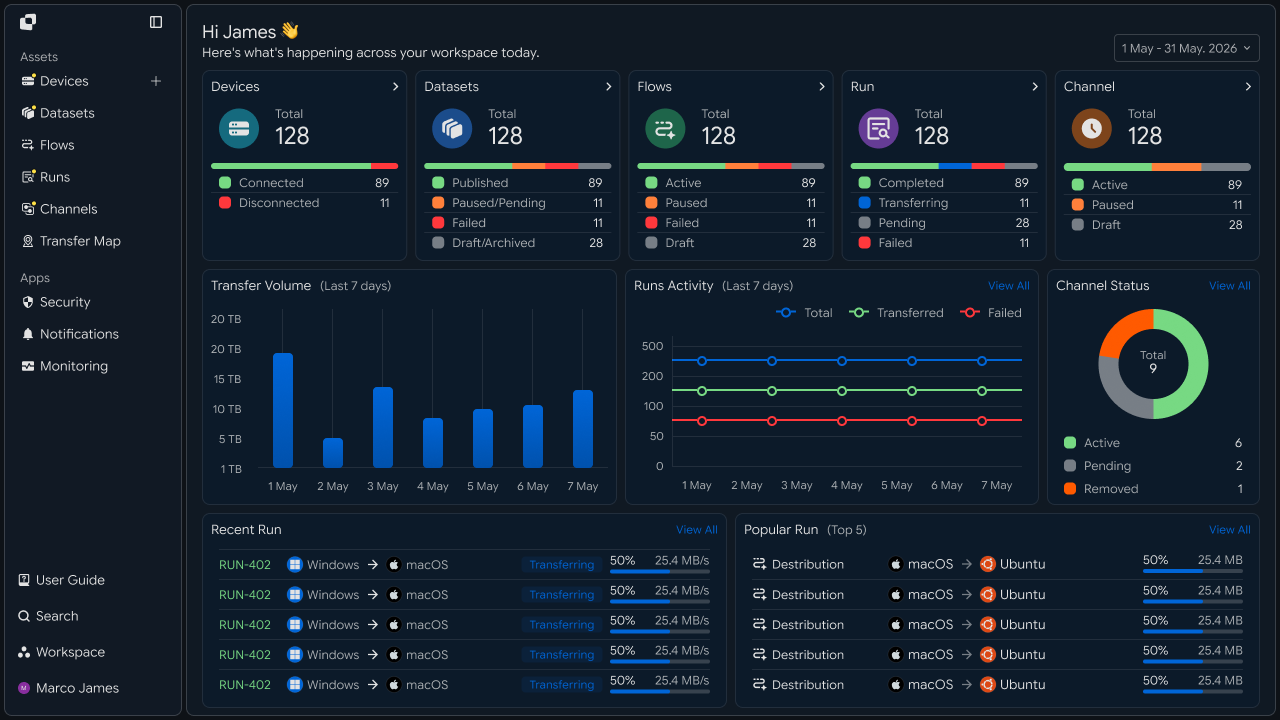
The dashboard can include the following information.
Current file transfers
Recently completed tasks
Throughput by device
Transfer volume by time period
Average execution time
Transfer speed changes
Key status events
This lets you review the current operational state of the file transfer environment alongside information from other systems.
Alert Settings
Send alerts based on key status changes and recovery events
Configure file transfer status and performance changes that operators need to review as event conditions.
When a configured condition occurs, connect it to the alerting flow used by the operations environment and manage recovery events after a task status change as well.
Monitoring Data
       │
       ▼
   Alert Rule
       │
 ┌─────┴─────┐
 ▼           ▼
Event      Recovery
Detected   Detected
 ▼           ▼
Alert      Recovery
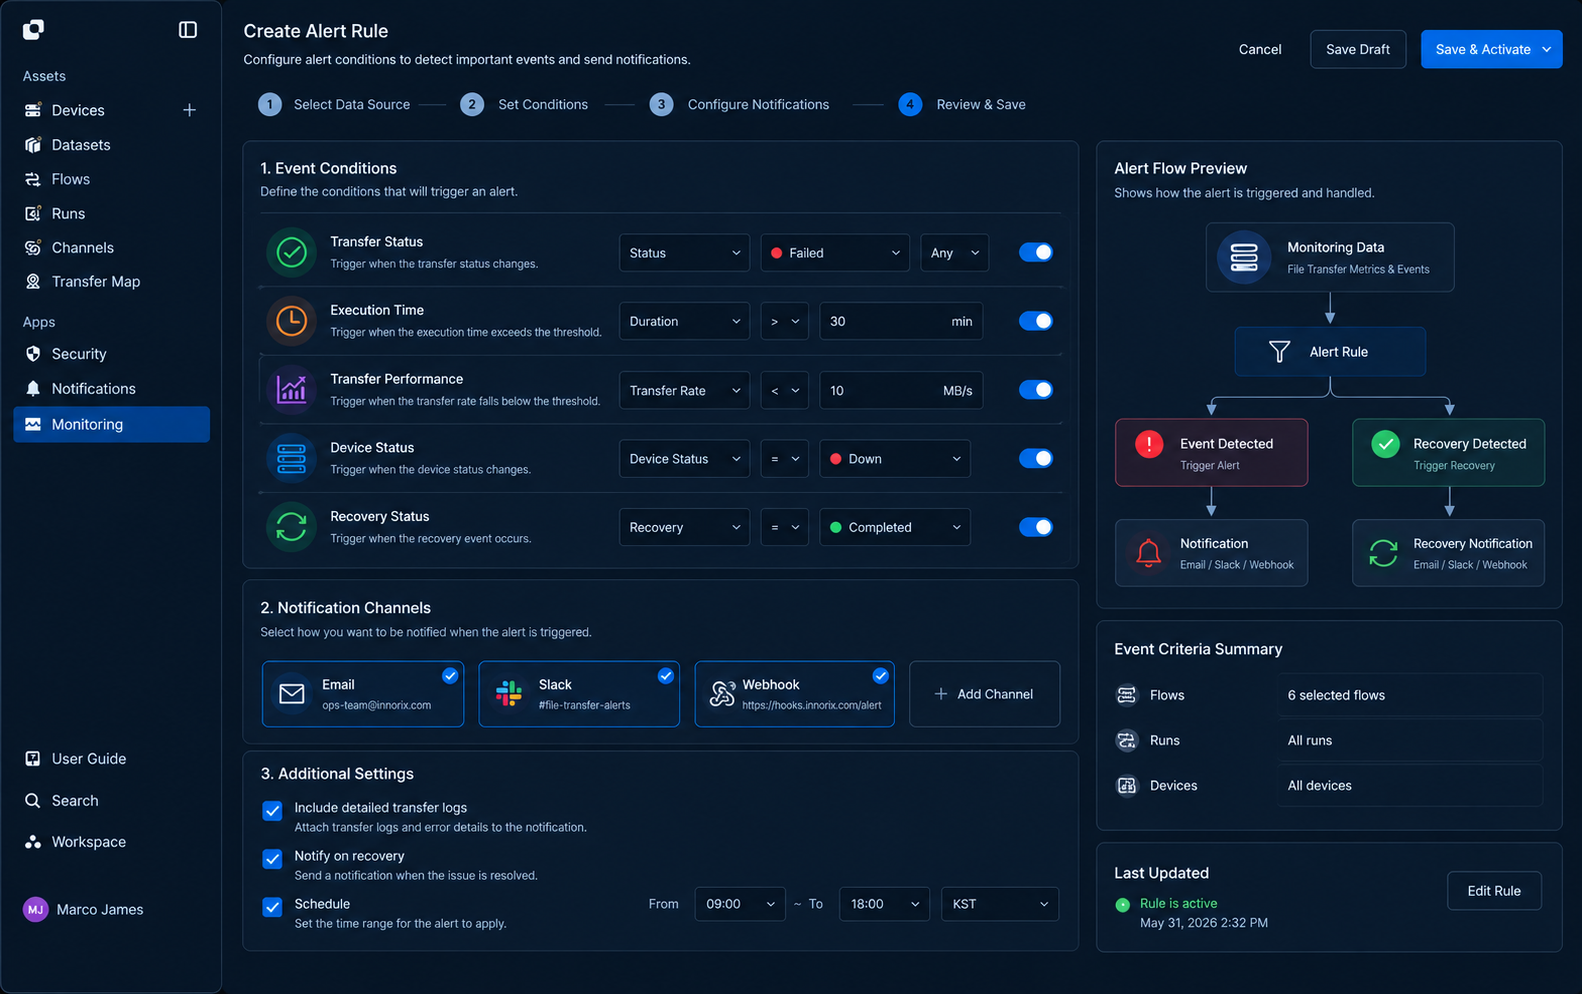
| Event Criteria | Use |
|---|---|
| Execution Status | Review key status changes |
| Execution Time | Review changes in processing time |
| Transfer Performance | Review changes against performance criteria |
| Device Status | Review execution status by device |
| Recovery Status | Review events that returned to a normal state |
Configuring alert criteria connects the file transfer events operators need to review to the existing monitoring process.
Recovery Tracking
Trace the process from an incident through rerun and recovery results
When an event requires attention, review the monitoring information and file transfer execution record from that point together.
Check the device status and performance information at the time of the event and the actual file transfer task that ran, then take the required action and track the rerun result.
Event
  │
  ▼
Run Details
  │
  ▼
Environment Check
  │
  ▼
Action
  │
  ▼
Retry
  │
  ▼
New Run
  │
  ▼
Recovery
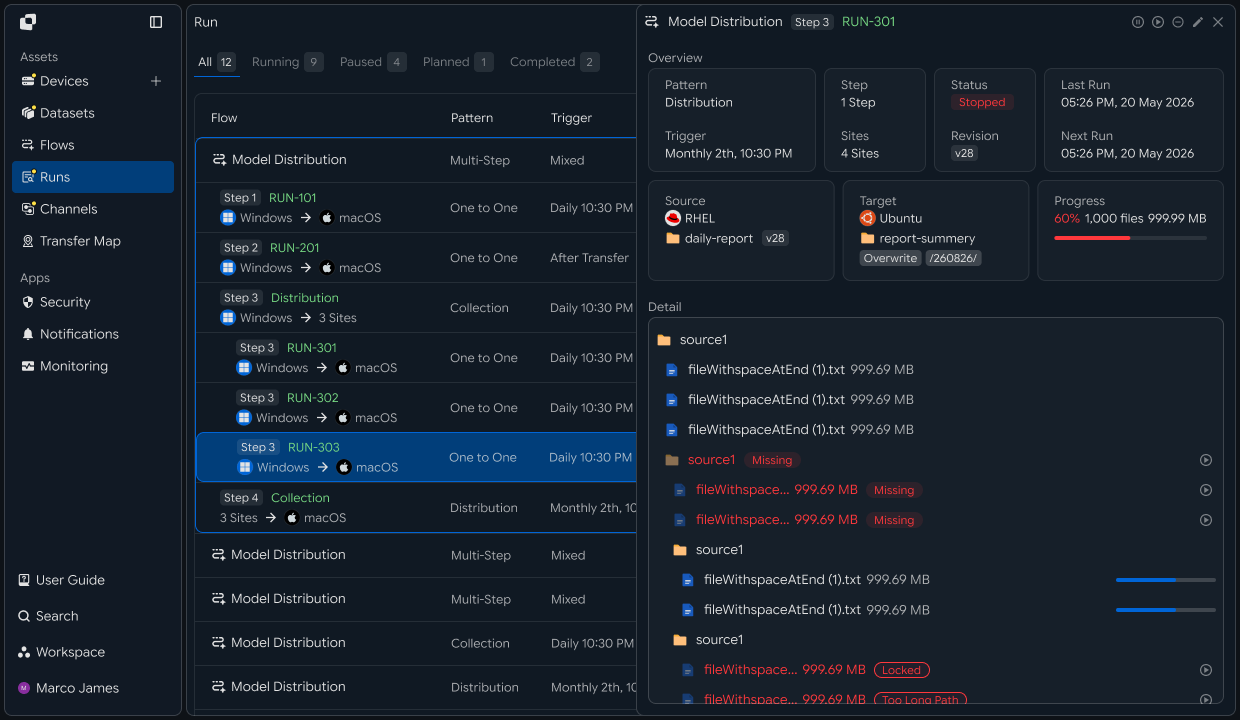
This flow lets you trace an event from the moment it occurs through response, rerun, and subsequent recovery status.
Operational Analysis
Analyze devices and task flows using accumulated transfer information
Execution information accumulated over a period can be used to analyze the long-term operational flow of the file transfer environment.
Separating data by device, Flow, and time lets you compare changes in throughput, execution time, and transfer performance.
             Transfer Data
                    │
       ┌────────────┼────────────┐
       ▼            ▼            ▼
     Device        Flow         Time
       │            │            │
       └────────────┼────────────┘
                    ▼
              Operations
               Analysis
                    │
       ┌────────────┼────────────┐
       ▼            ▼            ▼
     Volume       Duration    Performance
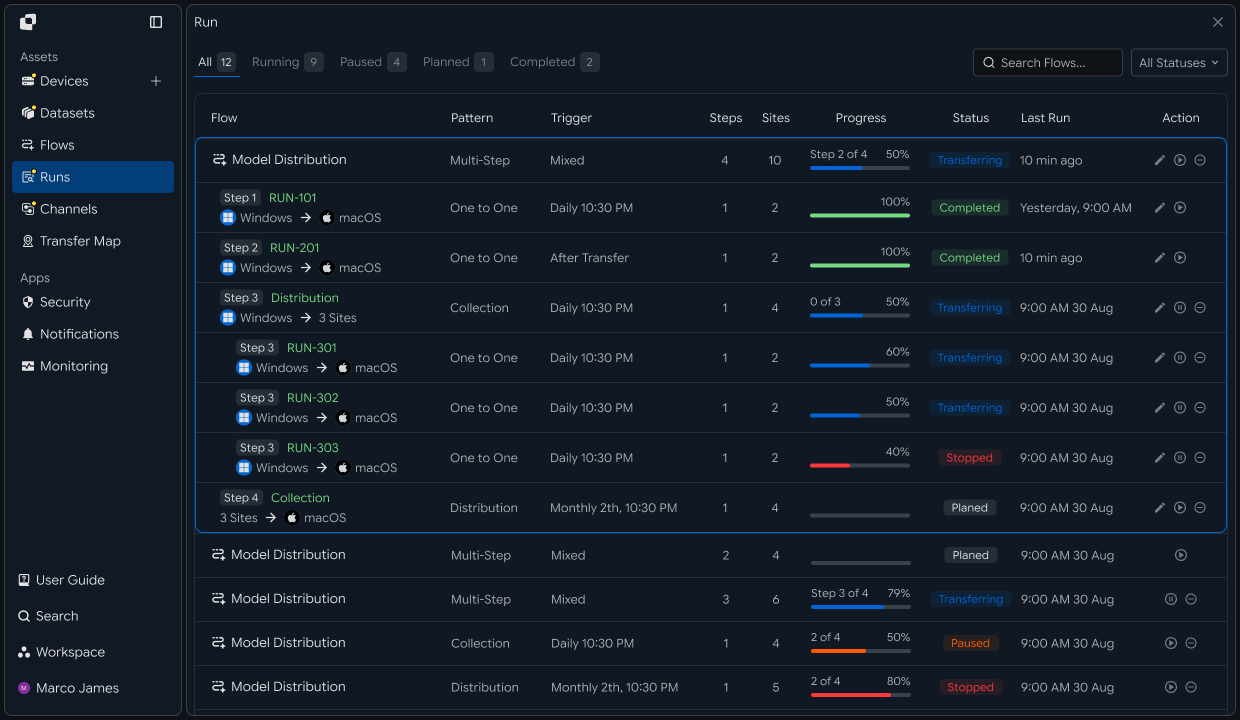
| Analysis Criteria | Details |
|---|---|
| By Device | Throughput and execution status by device |
| By Flow | Execution count and processing flow by task |
| By Period | Changes in transfer volume over time and by period |
| By Performance | Changes in processing time and transfer speed |
| By Event | Trends in key operational events |
Developers
Query transfer status and history and export them as metrics for monitoring tools
Integration Preparation
Prepare shared request code and cursor iteration
import os
import requests

BASE_URL = os.getenv("INNORIX_BASE_URL", "https://app.innorix.com").rstrip("/")
TOKEN = os.environ["INNORIX_ACCESS_TOKEN"]
WORKSPACE_ID = os.getenv("INNORIX_WORKSPACE_ID")   # optional; falls back to the current workspace

STATUS_COMPLETE = 2
TERMINAL = {2, 4, 5, 9, 99}          # complete / error / cancelled / partial / failed
NOT_SUCCEEDED = {4, 5, 9, 99}


def api(method, path, body=None, params=None):
    headers = {
        "Content-Type": "application/json",
        "Authorization": f"Bearer {TOKEN}",
    }

    if WORKSPACE_ID:
        headers["x-workspace-id"] = WORKSPACE_ID

    response = requests.request(
        method, BASE_URL + path,
        headers=headers, json=body, params=params, timeout=30,
    )

    payload = response.json() if response.content else {}

    if not response.ok:
        raise RuntimeError(payload.get("message") or f"HTTP {response.status_code}")

    return payload.get("data")


def is_terminal(detail):
    return detail.get("isTerminal", detail.get("status") in TERMINAL)
List queries use cursor pagination. Build one iteration helper and reuse it across multiple endpoints.
def paginate(path, params=None, limit=200, max_pages=50):
    query = dict(params or {})
    query["limit"] = limit
    cursor = None

    for _ in range(max_pages):
        if cursor:
            query["cursor"] = cursor

        result = api("GET", path, params=query) or {}

        for record in result.get("data") or []:
            yield record

        pagination = result.get("pagination") or {}

        if not pagination.get("hasMore"):
            return

        cursor = pagination.get("nextCursor")

        if not cursor:
            return
Transfer lists and history are returned in the data.data array, while pagination information is returned in data.pagination. Setting a page limit prevents collection scripts from running longer than expected when they encounter more history than anticipated.
Define Collection Scope
Define what information to obtain and where to obtain it
| Metric | Source | Format |
|---|---|---|
| Active transfer count and progress | /api/transfers | Cursor pagination |
| Completed transfer count and failure rate | /api/transfer-history | Cursor pagination |
| Failure rate by device | /api/devices/{deviceId}/transfer-history | Cursor pagination |
| Run results by automation | /api/automations/{automationId}/executions | Array |
| Device connectivity status | /api/devices + /connectivity | One call per device |
Start with a small number of metrics. The following four can answer most operational questions.
| Metric Name | Type | Question Answered |
|---|---|---|
transfer.active | Gauge | How many transfers are running now? |
transfer.completed · failed | Counter | How many succeeded and failed today? |
transfer.failure_rate | Gauge | Is the failure rate increasing? |
device.connected | Gauge | Is the device connected? |
Use a short interval for active status and a longer interval for history aggregation. Excessive requests return 429, so increase the connectivity polling interval in environments with many devices.
Status Queries
Retrieve active transfers and device status
def poll_active(automation_id=None):
    params = {"automationId": automation_id} if automation_id else None
    return list(paginate("/api/transfers", params=params, limit=50))


# list items expose id/progress; totalSize·fileCount live under detail
for record in poll_active():
    print(record["id"], record["statusName"], record.get("progress", 0),
          record["sourceDeviceName"], record["targetDeviceName"])
The application does not need to store the monitorId in advance to identify transfers. Transfers created through an operations screen or another path are also included in this list.
Device connectivity status requires one call per device.
def poll_devices():
    result = api("GET", "/api/devices", params={"page": 1, "size": 200}) or {}

    for device in result.get("devices") or []:
        state = api("GET", f"/api/devices/{device['deviceId']}/connectivity") or {}
        yield device["deviceId"], device["name"], bool(state.get("isConnected"))
The connectivity field in the response is isConnected. The accompanying stateLabel can be used directly on the screen.
For environments with hundreds of devices, use a longer polling interval and check only disconnected devices again at a shorter interval.
History Aggregation
Aggregate completed transfers to calculate the failure rate
from collections import Counter
from datetime import datetime, timedelta, timezone


def window(days):
    end = datetime.now(timezone.utc)
    fmt = "%Y-%m-%dT%H:%M:%SZ"
    return (end - timedelta(days=days)).strftime(fmt), end.strftime(fmt)


def history(days=1, device_id=None):
    start, end = window(days)
    params = {"startDate": start, "endDate": end}

    path = (f"/api/devices/{device_id}/transfer-history" if device_id
            else "/api/transfer-history")

    return list(paginate(path, params=params, limit=200))


def summarize(rows):
    counts = Counter(row.get("status") for row in rows)
    total = sum(counts.values())
    failed = sum(counts.get(code, 0) for code in NOT_SUCCEEDED)

    return {
        "total": total,
        "completed": counts.get(STATUS_COMPLETE, 0),
        "failed": failed,
        "failure_rate": failed / total if total else 0.0,
    }
Partial completion (9) and cancellation (5) are also terminal states. If you count only successes, failures will be treated as successes, so the only success value should be Complete (2).
Calculate the failure rate by device using the per-device history endpoint. This transfers less data than retrieving the entire history and dividing it on the client. For devices with few transfers, a single failure can cause the rate to spike, so include the count alongside the metric.
Export History Files
Retrieve complete history for audits and reporting
CSV export returns text rather than JSON. Receive the raw response without passing it through a JSON parser.
def export_csv(days, out_path):
    params = {
        "periodDays": days,
        "page": 1,
        "size": 10000,
        "filter": "[]",              # the server parses this as a JSON string, so send an empty array
        "sort": "startDate:desc",
    }

    response = requests.get(
        BASE_URL + "/api/transfer-history/export",
        headers={"Authorization": f"Bearer {TOKEN}"},
        params=params, timeout=120,
    )

    if not response.ok:
        raise RuntimeError(response.text[:200])

    with open(out_path, "w", encoding="utf-8-sig") as handle:
        handle.write(response.text)
Even when there are no conditions, send an empty array string ("[]") in filter because the server parses this value as JSON.
The fields allowed in sort are fixed.
| Allowed Fields |
|---|
status · sourceDeviceName · targetDeviceName · totalSize |
sourceFileCount · startDate · endDate · automationName |
formattedTransferTime · savedTime |
Using a field not listed, such as createdAt, results in rejection.
Transform and Send Metrics
Convert collected values into the format used by monitoring tools and send them
The number of label combinations directly determines the number of time series.
| Label | Allowed? |
|---|---|
| Source Device, Target Device | Yes |
| Automation Name | Yes |
| Workspace | Yes |
monitorId | No |
| File Path, File Name | No |
When per-transfer information is required, send it as logs or events rather than as metrics.
import time


def build_metrics(active_count, summary, devices):
    now = int(time.time())

    points = [
        {"metric": "innorix.transfer.active", "value": active_count, "tags": []},
        {"metric": "innorix.transfer.completed",
         "value": summary["completed"], "tags": []},
        {"metric": "innorix.transfer.failed",
         "value": summary["failed"], "tags": []},
        {"metric": "innorix.transfer.failure_rate",
         "value": round(summary["failure_rate"], 4), "tags": []},
    ]

    for device_id, name, connected in devices:
        points.append({
            "metric": "innorix.device.connected",
            "value": 1 if connected else 0,
            "tags": [f"device:{name}"],
        })

    return [{**p, "timestamp": now} for p in points]
Delays or failures in metric collection must not affect transfer processing. Run the collection script as a separate process isolated from the transfer path.
Register Alert Integrations
Register monitoring and collaboration tools as integration targets
Settings differ by integration type, so do not guess the values; retrieve the rules first.
rules = api("GET", "/api/integrations/rules",
            params={"category": "monitoring"}) or {}

for name, rule in rules.items():
    print(name, rule.get("category"), rule.get("modes"))

    for field in rule.get("fields") or []:
        mark = "required" if field.get("required") else "optional"
        print("   ", field["id"], field["label"], field["type"], mark)
When querying only one type, the response is returned with one additional nesting layer using the type name.
data = api("GET", "/api/integrations/rules/slack") or {}
rule = data.get("slack") or next(iter(data.values()), {})
The fields in the rules response are the keys to place in the config of the registration request.
VALID_EVENTS = ["started", "completed", "paused", "resumed",
                "recovered", "canceled", "error", "skipped"]

api("POST", "/api/integrations", {
    "name": "transfer alerts",
    "type": "slack",
    "mode": "webhook",
    "webhookUrl": WEBHOOK_URL,
    "config": {
        "name": "transfer alerts",
        "webhookUrl": WEBHOOK_URL,
        "channel": "#file-ops",
    },
    # toggle per event; this is what wires transfer events to the integration
    "notificationConfig": {"events": {"completed": True, "error": True}},
})
notificationConfig.events uses event names as keys with true/false values. Once registered, transfers in the same workspace automatically become notification targets.
| Review Item | Details |
|---|---|
| Collection Scope | Metrics to export |
| Query Scope | Period and status filters |
| CSV Export | Allowed fields for filter and sort |
| Labels | Combinations that determine the number of time series |
| Integration | Registered tools and notification events |